- Page 1 and 2:
NCO 2007:7Olyckor i siffrorEn rappo
- Page 3 and 4:
Olyckor i siffror2007 års utgåva
- Page 5:
InnehållsförteckningFörord .....
- Page 9 and 10:
våld, 236 till följd av annan ytt
- Page 11 and 12:
Enskilda olyckors miljöpåverkan
- Page 13 and 14:
De äldres fallskador leder till et
- Page 15 and 16:
mord, olycksfall bland äldre, för
- Page 17 and 18:
Dödsfall 2004orsakade av skadorMä
- Page 19 and 20:
2. Skadornas omfattning - en övers
- Page 21 and 22:
Antal förlorade levnadsår per1000
- Page 23 and 24:
Antal döda per100 000 invånare250
- Page 26 and 27:
Antal döda per100 000 invånare403
- Page 28 and 29:
Skador med oklar avsiktÄven katego
- Page 30 and 31:
3. Skador i olika arenorUppgifterna
- Page 32 and 33:
Andel80%70%60%50%40%30%20%10%0%Män
- Page 34 and 35:
Av nedanstående diagram framgår a
- Page 36 and 37:
Under senare år har ca 60-tal fotg
- Page 38 and 39:
2018161412KvinnorMän10864201 2 3 4
- Page 40 and 41:
Skador utomlandsAllt fler svenskar
- Page 42 and 43:
5. Sunda och säkra miljöer och pr
- Page 44 and 45:
Antal döda200MänKvinnor10001987 1
- Page 46 and 47:
att sedan plana ut och rentav minsk
- Page 48 and 49:
användningen av läkemedel är bil
- Page 50 and 51:
AlkoholSocialstyrelsen rapporterar
- Page 52 and 53:
70Andel i procent60MänKvinnor50403
- Page 54 and 55:
Många läkemedel som antidepressiv
- Page 56 and 57:
Många skadetyper är klart fattigd
- Page 58 and 59:
Eftergymnasial utbildning6%Gymnasie
- Page 60 and 61:
SlutsatserOm man ser de förändrin
- Page 62 and 63:
5. Riskutsatta grupperI detta kapit
- Page 64 and 65:
hemsända i 86 procent av fallen. I
- Page 66 and 67:
ekommenderades sjukhusvård eller g
- Page 68 and 69:
i fotboll skadar sig fler pojkar ä
- Page 70 and 71:
I figur 5.3. visas antalet dödade
- Page 72 and 73:
Cykel, moped7%Annat8%Buss, lastbil3
- Page 74 and 75:
Under perioden 1998 till 2005 vård
- Page 76 and 77:
ÅldersgruppÖver 80 år60 - 79 år
- Page 78 and 79:
Varför skadar sig äldre?Orsaksbil
- Page 80 and 81:
6. Skadeutvecklingen i Sverige iint
- Page 82 and 83:
SverigeStorbritannienHollandSchweiz
- Page 84 and 85:
LandGreklandPortugalItalienStorbrit
- Page 86 and 87:
Av totalt 7 745 insatser under peri
- Page 88 and 89:
UtsläppskällaAnnatBensinstationBo
- Page 90 and 91:
Ett skred eller ras är i många fa
- Page 92 and 93:
ÖversvämningarEn översvämning i
- Page 94 and 95:
förklaring. De värst drabbade omr
- Page 96 and 97:
mot olyckor, även om olycksbegrepp
- Page 98 and 99:
FlygsäkerhetLuftfartsstyrelsen har
- Page 100 and 101:
Övriga säkerhetsområdenListan ö
- Page 102 and 103:
att öka säkerheten. Förfinade m
- Page 104 and 105:
KostnadstyperDe ekonomiska konsekve
- Page 106 and 107:
Är skadebilden för de olika ålde
- Page 108 and 109:
ReferenserArbetsmiljöverket, Infor
- Page 110 and 111:
Bilaga 1Bilaga 1: Döda och slutenv
- Page 112 and 113:
Bilaga 1Skador, 1990-2004Tabell 1An
- Page 114 and 115:
Bilaga 1Olycksfall, 1990-2004Tabell
- Page 116 and 117:
Bilaga 1Annan transportolyckaDiagra
- Page 118 and 119:
Bilaga 1FörgiftningDiagram 6.1Anta
- Page 120 and 121:
Bilaga 1Öppen eldDiagram 8.1Antal
- Page 122 and 123:
Bilaga 1KvävningDiagram 10.1Antal
- Page 124 and 125:
Bilaga 1Annat föremålDiagram 12.1
- Page 126 and 127:
Bilaga 1MaskinolyckaDiagram 14.1Ant
- Page 128 and 129:
Bilaga 1ElektricitetDiagram 16.1Ant
- Page 130 and 131:
Bilaga 1Främmande kropp i naturlig
- Page 132 and 133: Bilaga 1Avsiktlig självdestruktiv
- Page 134 and 135: Bilaga 1Skadehändelse med oklar av
- Page 136 and 137: Bilaga 1Skador, 1987-2005Diagram 24
- Page 138 and 139: Bilaga 1Olycksfall, 1987-2005Diagra
- Page 140 and 141: Bilaga 1Bilaga 1VägtransportDiagra
- Page 142 and 143: Bilaga 1FallDiagram 28.1Antal slute
- Page 144 and 145: Bilaga 1Bilaga 1DrunkningDiagram 30
- Page 146 and 147: Bilaga 1Stark kylaDiagram 32.1Antal
- Page 148 and 149: Bilaga 1Fallande föremålDiagram 3
- Page 150 and 151: Bilaga 1Skjutvapen, explosiv varaDi
- Page 152 and 153: Bilaga 1Heta ämnen eller föremål
- Page 154 and 155: Bilaga 1Djur, insekter och giftiga
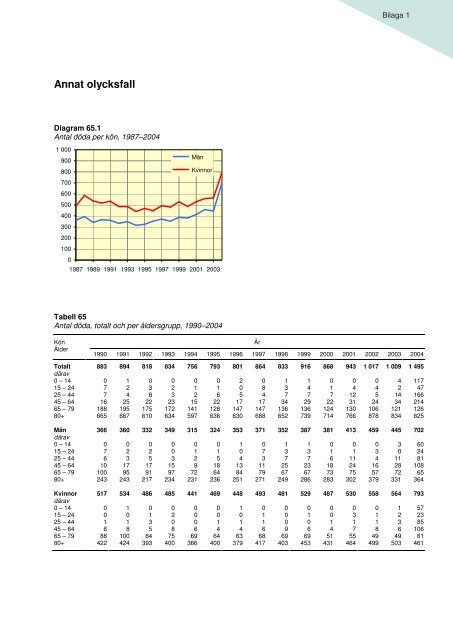
- Page 156 and 157: Bilaga 1Annat olycksfallDiagram 42.
- Page 158 and 159: Bilaga 1Avsiktlig självdestruktiv
- Page 160 and 161: Bilaga 1Övergrepp av annan person,
- Page 162 and 163: Bilaga 1Annan yttre orsakDiagram 46
- Page 164 and 165: Bilaga 1Skador, 1990-2004Tabell 47A
- Page 166 and 167: Bilaga 1Olycksfall, 1990-2004Tabell
- Page 168 and 169: Bilaga 1Annan transportolyckaDiagra
- Page 170 and 171: Bilaga 1FörgiftningDiagram 52.1Ant
- Page 172 and 173: Bilaga 1Öppen eldDiagram 54.1Antal
- Page 174 and 175: Bilaga 1KvävningDiagram 56.1Antal
- Page 176 and 177: Bilaga 1Annat föremålDiagram 58.1
- Page 178 and 179: Bilaga 1MaskinolyckaDiagram 60.1Ant
- Page 180 and 181: Bilaga 1ElektricitetDiagram 62.1Ant
- Page 184 and 185: Bilaga 1Avsiktlig självdestruktiv
- Page 186 and 187: Bilaga 1Skadehändelse med oklar av
- Page 188 and 189: Bilaga 1Skador, 1987-2005Diagram 70
- Page 190 and 191: Bilaga 1Olycksfall, 1987-2005Diagra
- Page 192 and 193: Bilaga 1Bilaga 1VägtransportDiagra
- Page 194 and 195: Bilaga 1FallDiagram 74.1Antal slute
- Page 196 and 197: Bilaga 1Bilaga 1DrunkningDiagram 76
- Page 198 and 199: Bilaga 1Stark kylaDiagram 78.1Antal
- Page 200 and 201: Bilaga 1Fallande föremålDiagram 8
- Page 202 and 203: Bilaga 1Skjutvapen, explosiv varaDi
- Page 204 and 205: Bilaga 1Heta ämnen eller föremål
- Page 206 and 207: Bilaga 1Djur, insekter och giftiga
- Page 208 and 209: Bilaga 1Annat olycksfallDiagram 88.
- Page 210 and 211: Bilaga 1Avsiktlig självdestruktiv
- Page 212 and 213: Bilaga 1Övergrepp av annan person,
- Page 214 and 215: Bilaga 1Annan yttre orsakDiagram 92
- Page 216 and 217: Bilaga 2TabellförteckningBilaga 2:
- Page 218 and 219: Bilaga 2Hem/fritid BostadHem/fritid
- Page 220 and 221: Bilaga 2Hem/fritid BostadTabell 7Pl
- Page 222 and 223: Bilaga 2Hem/fritid ÖvrigaHem/Friti
- Page 224 and 225: Bilaga 2Hem/fritid ÖvrigaTabell 19
- Page 226 and 227: Bilaga 2ArbeteArbeteBilaga 2ArbeteT
- Page 228 and 229: Bilaga 2ArbeteBilaga 2ArbeteTabell
- Page 230 and 231: Bilaga 2 Hem/fritid SkolaBilaga 2He
- Page 232 and 233:
Bilaga 2Hem/fritid SportHem och fri
- Page 234 and 235:
Bilaga 2 Hem/fritid Sport Bilaga 2H
- Page 236 and 237:
Bilaga 2Hem/fritid SportTabell 45Pl
- Page 238 and 239:
Bilaga 2TrafikTrafikBilaga 2TrafikT
- Page 240:
Rapporter från Räddningsverket/NC