Acta Scientiarum Oeconomia 9 (1)
Acta Scientiarum Oeconomia 9 (1)
Acta Scientiarum Oeconomia 9 (1)

Create successful ePaper yourself
Turn your PDF publications into a flip-book with our unique Google optimized e-Paper software.
52<br />
M.A. Geheder, M.S. Moussa, E.R. Shnibesh, A.A. Yousef<br />
$ 40 dollars in the world markets after the Islamic revolution of Iran. While in 1985,<br />
total exports recorded LD 3645 million and LD 3745 million in 1990, as a consequence<br />
of increases of oil price in some years. However, during the period 1992–2000, Libyan<br />
exports witnessed a different situation following the U.N sanctions imposed against the<br />
country in 1992, which affected the oil sector by prohibited providing Libya’s oil industry<br />
with its needs of oil equipments. So, the total exports which predominantly consisted of<br />
oil exports accounted LD 3038 million, LD 3017 million and LD 3578 million in the<br />
years 1992, 1994, 1996 respectively. While in 2006 after the lifting of U.N sanctions,<br />
and the increasing of oil prices in the world market, the value of exports recorded its high<br />
level since 1980.<br />
GEOGRAPHICAL DISTRIBUTION OF IMPORTS<br />
Due to the historical ties between Libya and the European countries, the EU has<br />
been considered as a traditional market for Libya’s imports during the whole period<br />
1970–2005. Nonetheless, the percentage share of the value of these imports was 71.3%<br />
in 1970, increased to 71.9% in 1983. In 1987, the share of imports from the EU reached<br />
72%, and 57% in 2006. Italy, Germany, the United Kingdom, and France have remained<br />
the major partners of Libya. The percentage share of imports from the EU continued<br />
rising until it has reached 70.4 per cent before declining again to 63 per cent in 1988.<br />
It then accounted for 61.5 per cent, 57 per cent, 55 per cent and 57 per cent of total<br />
imports in the years 1990, 1995, 2000, and 2006 respectively [Central Bank of Libya<br />
2007].<br />
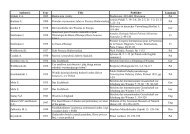
Table 3. Value of Libya’s Imports from the Largest Trading Partners, 1997–2001 ($ million)<br />
Tabela 3. Wartość libijskiego importu według głównych partnerów handlowych w latach 1997–<br />
2001 w milionach $<br />
Partner 1997 1998 1999 2000 2001 2006<br />
Italy 1113 1210 1012 1041 1268 1650<br />
Germany 595 607 542 403 538 832<br />
UK 485 428 315 311 292 520<br />
France 373 311 277 288 261 579<br />
Spain 250 178 281 291 266 560<br />
Source: Central Bank of Libya, Annual Reports, 1997–2007.<br />
Źródło: Bank Centralny Libii, roczne raporty, 1997–2007.<br />
TRENDS OF LIBYAN FOREIGN TRADE<br />
Per capita imports and exports reveal a strong trade exchange between Libya and the<br />
EU, at least if compared to other important North African countries and between African<br />
blocs, as the following two tables show.<br />
<strong>Acta</strong> Sci. Pol.