9-2015
Fachzeitschrift für Hochfrequenz- und Mikrowellentechnik
Fachzeitschrift für Hochfrequenz- und Mikrowellentechnik

Erfolgreiche ePaper selbst erstellen
Machen Sie aus Ihren PDF Publikationen ein blätterbares Flipbook mit unserer einzigartigen Google optimierten e-Paper Software.
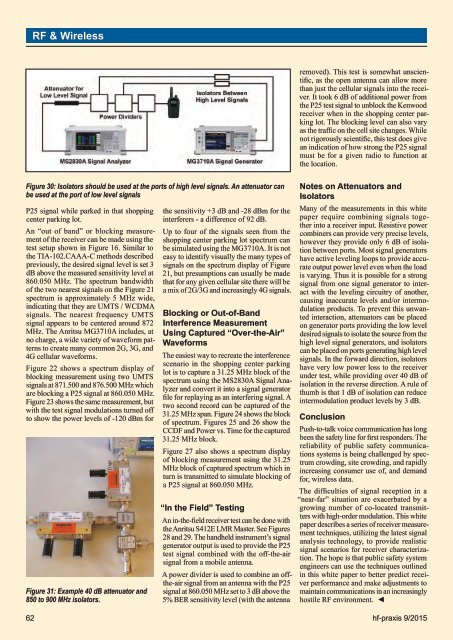
RF & Wirelessremoved). This test is somewhat unscientific,as the open antenna can allow morethan just the cellular signals into the receiver.It took 6 dB of additional power fromthe P25 test signal to unblock the Kenwoodreceiver when in the shopping center parkinglot. The blocking level can also varyas the traffic on the cell site changes. Whilenot rigorously scientific, this test does givean indication of how strong the P25 signalmust be for a given radio to function atthe location.Figure 30: Isolators should be used at the ports of high level signals. An attenuator canbe used at the port of low level signalsP25 signal while parked in that shoppingcenter parking lot.An “out of band” or blocking measurementof the receiver can be made using thetest setup shown in Figure 16. Similar tothe TIA-102.CAAA-C methods describedpreviously, the desired signal level is set 3dB above the measured sensitivity level at860.050 MHz. The spectrum bandwidthof the two nearest signals on the Figure 21spectrum is approximately 5 MHz wide,indicating that they are UMTS / WCDMAsignals. The nearest frequency UMTSsignal appears to be centered around 872MHz. The Anritsu MG3710A includes, atno charge, a wide variety of waveform patternsto create many common 2G, 3G, and4G cellular waveforms.Figure 22 shows a spectrum display ofblocking measurement using two UMTSsignals at 871.500 and 876.500 MHz whichare blocking a P25 signal at 860.050 MHz.Figure 23 shows the same measurement, butwith the test signal modulations turned offto show the power levels of -120 dBm forFigure 31: Example 40 dB attenuator and850 to 900 MHz isolators.the sensitivity +3 dB and -28 dBm for theinterferers - a difference of 92 dB.Up to four of the signals seen from theshopping center parking lot spectrum canbe simulated using the MG3710A. It is noteasy to identify visually the many types ofsignals on the spectrum display of Figure21, but presumptions can usually be madethat for any given cellular site there will bea mix of 2G/3G and increasingly 4G signals.Blocking or Out-of-BandInterference MeasurementUsing Captured “Over-the-Air”WaveformsThe easiest way to recreate the interferencescenario in the shopping center parkinglot is to capture a 31.25 MHz block of thespectrum using the MS2830A Signal Analyzerand convert it into a signal generatorfile for replaying as an interfering signal. Atwo second record can be captured of the31.25 MHz span. Figure 24 shows the blockof spectrum. Figures 25 and 26 show theCCDF and Power vs. Time for the captured31.25 MHz block.Figure 27 also shows a spectrum displayof blocking measurement using the 31.25MHz block of captured spectrum which inturn is transmitted to simulate blocking ofa P25 signal at 860.050 MHz.“In the Field” TestingAn in-the-field receiver test can be done withthe Anritsu S412E LMR Master. See Figures28 and 29. The handheld instrument’s signalgenerator output is used to provide the P25test signal combined with the off-the-airsignal from a mobile antenna.A power divider is used to combine an offthe-airsignal from an antenna with the P25signal at 860.050 MHz set to 3 dB above the5% BER sensitivity level (with the antennaNotes on Attenuators andIsolatorsMany of the measurements in this whitepaper require combining signals togetherinto a receiver input. Resistive powercombiners can provide very precise levels,however they provide only 6 dB of isolationbetween ports. Most signal generatorshave active leveling loops to provide accurateoutput power level even when the loadis varying. Thus it is possible for a strongsignal from one signal generator to interactwith the leveling circuitry of another,causing inaccurate levels and/or intermodulationproducts. To prevent this unwantedinteraction, attenuators can be placedon generator ports providing the low leveldesired signals to isolate the source from thehigh level signal generators, and isolatorscan be placed on ports generating high levelsignals. In the forward direction, isolatorshave very low power loss to the receiverunder test, while providing over 40 dB ofisolation in the reverse direction. A rule ofthumb is that 1 dB of isolation can reduceintermodulation product levels by 3 dB.ConclusionPush-to-talk voice communication has longbeen the safety line for first responders. Thereliability of public safety communicationssystems is being challenged by spectrumcrowding, site crowding, and rapidlyincreasing consumer use of, and demandfor, wireless data.The difficulties of signal reception in a“near-far” situation are exacerbated by agrowing number of co-located transmitterswith high-order modulation. This whitepaper describes a series of receiver measurementtechniques, utilizing the latest signalanalysis technology, to provide realisticsignal scenarios for receiver characterization.The hope is that public safety systemengineers can use the techniques outlinedin this white paper to better predict receiverperformance and make adjustments tomaintain communications in an increasinglyhostile RF environment. ◄62 hf-praxis 9/<strong>2015</strong>