Past Climate Variability and Change in the Arctic and at High Latitudes
Past Climate Variability and Change in the Arctic and at High Latitudes
Past Climate Variability and Change in the Arctic and at High Latitudes

You also want an ePaper? Increase the reach of your titles
YUMPU automatically turns print PDFs into web optimized ePapers that Google loves.
50<br />
The U.S. <strong>Clim<strong>at</strong>e</strong> Science Program Chapter 3<br />
A B<br />
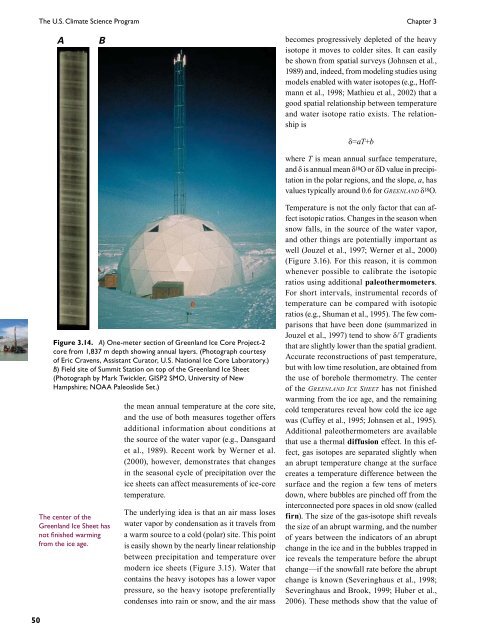
Figure 3.14. A) One-meter section of Greenl<strong>and</strong> Ice Core Project-2<br />
core from 1,837 m depth show<strong>in</strong>g annual layers. (Photograph courtesy<br />
of Eric Cravens, Assistant Cur<strong>at</strong>or, U.S. N<strong>at</strong>ional Ice Core Labor<strong>at</strong>ory.)<br />
B) Field site of Summit St<strong>at</strong>ion on top of <strong>the</strong> Greenl<strong>and</strong> Ice Sheet<br />
(Photograph by Mark Twickler, GISP2 SMO, University of New<br />
Hampshire; NOAA Paleoslide Set.)<br />
The center of <strong>the</strong><br />
Greenl<strong>and</strong> Ice Sheet has<br />
not f<strong>in</strong>ished warm<strong>in</strong>g<br />
from <strong>the</strong> ice age.<br />
<strong>the</strong> mean annual temper<strong>at</strong>ure <strong>at</strong> <strong>the</strong> core site,<br />
<strong>and</strong> <strong>the</strong> use of both measures toge<strong>the</strong>r offers<br />
additional <strong>in</strong>form<strong>at</strong>ion about conditions <strong>at</strong><br />
<strong>the</strong> source of <strong>the</strong> w<strong>at</strong>er vapor (e.g., Dansgaard<br />
et al., 1989). Recent work by Werner et al.<br />
(2000), however, demonstr<strong>at</strong>es th<strong>at</strong> changes<br />
<strong>in</strong> <strong>the</strong> seasonal cycle of precipit<strong>at</strong>ion over <strong>the</strong><br />
ice sheets can affect measurements of ice-core<br />
temper<strong>at</strong>ure.<br />
The underly<strong>in</strong>g idea is th<strong>at</strong> an air mass loses<br />
w<strong>at</strong>er vapor by condens<strong>at</strong>ion as it travels from<br />
a warm source to a cold (polar) site. This po<strong>in</strong>t<br />
is easily shown by <strong>the</strong> nearly l<strong>in</strong>ear rel<strong>at</strong>ionship<br />
between precipit<strong>at</strong>ion <strong>and</strong> temper<strong>at</strong>ure over<br />
modern ice sheets (Figure 3.15). W<strong>at</strong>er th<strong>at</strong><br />
conta<strong>in</strong>s <strong>the</strong> heavy isotopes has a lower vapor<br />
pressure, so <strong>the</strong> heavy isotope preferentially<br />
condenses <strong>in</strong>to ra<strong>in</strong> or snow, <strong>and</strong> <strong>the</strong> air mass<br />
becomes progressively depleted of <strong>the</strong> heavy<br />
isotope it moves to colder sites. It can easily<br />
be shown from sp<strong>at</strong>ial surveys (Johnsen et al.,<br />
1989) <strong>and</strong>, <strong>in</strong>deed, from model<strong>in</strong>g studies us<strong>in</strong>g<br />
models enabled with w<strong>at</strong>er isotopes (e.g., Hoffmann<br />
et al., 1998; M<strong>at</strong>hieu et al., 2002) th<strong>at</strong> a<br />
good sp<strong>at</strong>ial rel<strong>at</strong>ionship between temper<strong>at</strong>ure<br />
<strong>and</strong> w<strong>at</strong>er isotope r<strong>at</strong>io exists. The rel<strong>at</strong>ionship<br />
is<br />
δ=aT+b<br />
where T is mean annual surface temper<strong>at</strong>ure,<br />
<strong>and</strong> δ is annual mean δ 18O or δD value <strong>in</strong> precipit<strong>at</strong>ion<br />
<strong>in</strong> <strong>the</strong> polar regions, <strong>and</strong> <strong>the</strong> slope, a, has<br />
values typically around 0.6 for GreenlAnd δ 18O.<br />
Temper<strong>at</strong>ure is not <strong>the</strong> only factor th<strong>at</strong> can affect<br />
isotopic r<strong>at</strong>ios. <strong>Change</strong>s <strong>in</strong> <strong>the</strong> season when<br />
snow falls, <strong>in</strong> <strong>the</strong> source of <strong>the</strong> w<strong>at</strong>er vapor,<br />
<strong>and</strong> o<strong>the</strong>r th<strong>in</strong>gs are potentially important as<br />
well (Jouzel et al., 1997; Werner et al., 2000)<br />
(Figure 3.16). For this reason, it is common<br />
whenever possible to calibr<strong>at</strong>e <strong>the</strong> isotopic<br />
r<strong>at</strong>ios us<strong>in</strong>g additional paleo<strong>the</strong>rmometers.<br />
For short <strong>in</strong>tervals, <strong>in</strong>strumental records of<br />
temper<strong>at</strong>ure can be compared with isotopic<br />
r<strong>at</strong>ios (e.g., Shuman et al., 1995). The few comparisons<br />
th<strong>at</strong> have been done (summarized <strong>in</strong><br />
Jouzel et al., 1997) tend to show δ/T gradients<br />
th<strong>at</strong> are slightly lower than <strong>the</strong> sp<strong>at</strong>ial gradient.<br />
Accur<strong>at</strong>e reconstructions of past temper<strong>at</strong>ure,<br />
but with low time resolution, are obta<strong>in</strong>ed from<br />
<strong>the</strong> use of borehole <strong>the</strong>rmometry. The center<br />
of <strong>the</strong> GreenlAnd ice Sheet has not f<strong>in</strong>ished<br />
warm<strong>in</strong>g from <strong>the</strong> ice age, <strong>and</strong> <strong>the</strong> rema<strong>in</strong><strong>in</strong>g<br />
cold temper<strong>at</strong>ures reveal how cold <strong>the</strong> ice age<br />
was (Cuffey et al., 1995; Johnsen et al., 1995).<br />
Additional paleo<strong>the</strong>rmometers are available<br />
th<strong>at</strong> use a <strong>the</strong>rmal diffusion effect. In this effect,<br />
gas isotopes are separ<strong>at</strong>ed slightly when<br />
an abrupt temper<strong>at</strong>ure change <strong>at</strong> <strong>the</strong> surface<br />
cre<strong>at</strong>es a temper<strong>at</strong>ure difference between <strong>the</strong><br />
surface <strong>and</strong> <strong>the</strong> region a few tens of meters<br />
down, where bubbles are p<strong>in</strong>ched off from <strong>the</strong><br />
<strong>in</strong>terconnected pore spaces <strong>in</strong> old snow (called<br />
firn). The size of <strong>the</strong> gas-isotope shift reveals<br />
<strong>the</strong> size of an abrupt warm<strong>in</strong>g, <strong>and</strong> <strong>the</strong> number<br />
of years between <strong>the</strong> <strong>in</strong>dic<strong>at</strong>ors of an abrupt<br />
change <strong>in</strong> <strong>the</strong> ice <strong>and</strong> <strong>in</strong> <strong>the</strong> bubbles trapped <strong>in</strong><br />
ice reveals <strong>the</strong> temper<strong>at</strong>ure before <strong>the</strong> abrupt<br />
change—if <strong>the</strong> snowfall r<strong>at</strong>e before <strong>the</strong> abrupt<br />
change is known (Sever<strong>in</strong>ghaus et al., 1998;<br />
Sever<strong>in</strong>ghaus <strong>and</strong> Brook, 1999; Huber et al.,<br />
2006). These methods show th<strong>at</strong> <strong>the</strong> value of