Hyperbaric Oxygen Therapy - Hyperbaric Chamber Information ...
Hyperbaric Oxygen Therapy - Hyperbaric Chamber Information ...
Hyperbaric Oxygen Therapy - Hyperbaric Chamber Information ...

Create successful ePaper yourself
Turn your PDF publications into a flip-book with our unique Google optimized e-Paper software.
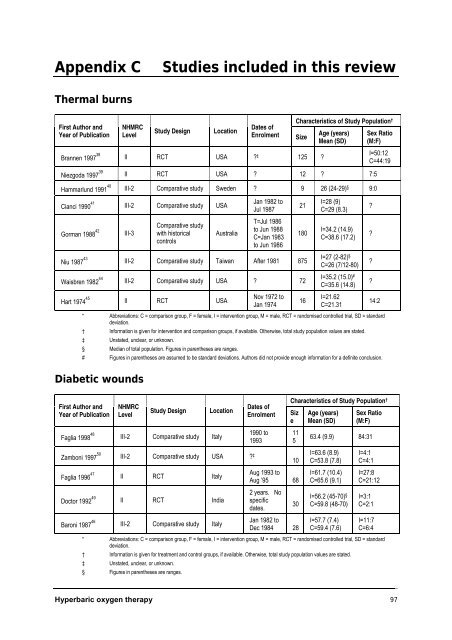
Appendix C Studies included in this review<br />
Thermal burns<br />
First Author and<br />
Year of Publication<br />
Brannen 1997 38<br />
Niezgoda 1997 39<br />
Hammarlund 1991 40<br />
Cianci 1990 41<br />
Gorman 1988 42<br />
Niu 1987 43<br />
Waisbren 1982 44<br />
Hart 1974 45<br />
NHMRC<br />
Level<br />
Study Design Location<br />
Dates of<br />
Enrolment Size<br />
II RCT USA ? ‡ 125 ?<br />
Characteristics of Study Population †<br />
Age (years)<br />
Mean (SD)<br />
II RCT USA ? 12 ? 7:5<br />
III-2 Comparative study Sweden ? 9 26 (24-29) § 9:0<br />
III-2 Comparative study USA<br />
III-3<br />
Comparative study<br />
with historical<br />
controls<br />
Australia<br />
Jan 1982 to<br />
Jul 1987<br />
T=Jul 1986<br />
to Jun 1988<br />
C=Jan 1983<br />
to Jun 1986<br />
Sex Ratio<br />
(M:F)<br />
I=50:12<br />
C=44:19<br />
<strong>Hyperbaric</strong> oxygen therapy 97<br />
21<br />
180<br />
III-2 Comparative study Taiwan After 1981 875<br />
III-2 Comparative study USA ? 72<br />
II RCT USA<br />
Nov 1972 to<br />
Jan 1974<br />
16<br />
I=28 (9)<br />
C=29 (8.3)<br />
I=34.2 (14.9)<br />
C=38.6 (17.2)<br />
I=27 (2-82) §<br />
C=26 (7/12-80)<br />
I=35.2 (15.0) #<br />
C=35.6 (14.8)<br />
I=21.62<br />
C=21.31<br />
* Abbreviations: C = comparison group, F = female, I = intervention group, M = male, RCT = randomised controlled trial, SD = standard<br />
deviation.<br />
† <strong>Information</strong> is given for intervention and comparison groups, if available. Otherwise, total study population values are stated.<br />
‡ Unstated, unclear, or unknown.<br />
§ Median of total population. Figures in parentheses are ranges.<br />
# Figures in parentheses are assumed to be standard deviations. Authors did not provide enough information for a definite conclusion.<br />
Diabetic wounds<br />
First Author and<br />
Year of Publication<br />
Faglia 1998 48<br />
Zamboni 1997 50<br />
Faglia 1996 47<br />
Doctor 1992 49<br />
Baroni 1987 46<br />
NHMRC<br />
Level<br />
Study Design Location<br />
III-2 Comparative study Italy<br />
III-2 Comparative study USA ? ‡<br />
II RCT Italy<br />
II RCT India<br />
III-2 Comparative study Italy<br />
Dates of<br />
Enrolment<br />
1990 to<br />
1993<br />
?<br />
?<br />
?<br />
?<br />
14:2<br />
Characteristics of Study Population †<br />
Siz<br />
e<br />
11<br />
5<br />
10<br />
Aug 1993 to<br />
Aug ’95 68<br />
2 years. No<br />
specific<br />
dates.<br />
30<br />
Jan 1982 to<br />
Dec 1984 28<br />
Age (years)<br />
Mean (SD)<br />
Sex Ratio<br />
(M:F)<br />
63.4 (9.9) 84:31<br />
I=63.6 (8.9)<br />
C=53.8 (7.8)<br />
I=61.7 (10.4)<br />
C=65.6 (9.1)<br />
I=56.2 (45-70) §<br />
C=59.8 (48-70)<br />
I=57.7 (7.4)<br />
C=59.4 (7.6)<br />
I=4:1<br />
C=4:1<br />
I=27:8<br />
C=21:12<br />
I=3:1<br />
C=2:1<br />
I=11:7<br />
C=6:4<br />
* Abbreviations: C = comparison group, F = female, I = intervention group, M = male, RCT = randomised controlled trial, SD = standard<br />
deviation.<br />
† <strong>Information</strong> is given for treatment and control groups, if available. Otherwise, total study population values are stated.<br />
‡ Unstated, unclear, or unknown.<br />
§ Figures in parentheses are ranges.