Hyperbaric Oxygen Therapy - Hyperbaric Chamber Information ...
Hyperbaric Oxygen Therapy - Hyperbaric Chamber Information ...
Hyperbaric Oxygen Therapy - Hyperbaric Chamber Information ...

Create successful ePaper yourself
Turn your PDF publications into a flip-book with our unique Google optimized e-Paper software.
Nevertheless, both studies were of sufficient clinical and epidemiological similarity to<br />
attempt statistical pooling. Unfortunately, neither study examined the same outcomes in<br />
the same way, and individual data points are not given with which to manipulate<br />
statistically the effect measures for transformation on a common scale. Therefore, the<br />
review did not attempt a pooled estimate of treatment effect. Instead a brief description<br />
of results of the two studies follows.<br />
Review of published clinical experience<br />
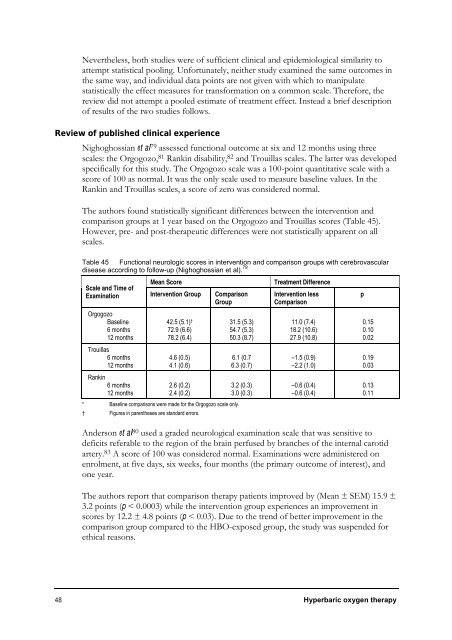
Nighoghossian et al79 assessed functional outcome at six and 12 months using three<br />
scales: the Orgogozo, 81 Rankin disability, 82 and Trouillas scales. The latter was developed<br />
specifically for this study. The Orgogozo scale was a 100-point quantitative scale with a<br />
score of 100 as normal. It was the only scale used to measure baseline values. In the<br />
Rankin and Trouillas scales, a score of zero was considered normal.<br />
The authors found statistically significant differences between the intervention and<br />
comparison groups at 1 year based on the Orgogozo and Trouillas scores (Table 45).<br />
However, pre- and post-therapeutic differences were not statistically apparent on all<br />
scales.<br />
Table 45 Functional neurologic scores in intervention and comparison groups with cerebrovascular<br />
disease according to follow-up (Nighoghossian et al). 79<br />
Mean Score Treatment Difference<br />
Scale and Time of<br />
Examination Intervention Group Comparison<br />
Group<br />
Orgogozo<br />
Baseline<br />
6 months<br />
12 months<br />
Trouillas<br />
6 months<br />
12 months<br />
Rankin<br />
6 months<br />
12 months<br />
42.5 (5.1) †<br />
72.9 (6.6)<br />
78.2 (6.4)<br />
4.6 (0.5)<br />
4.1 (0.6)<br />
2.6 (0.2)<br />
2.4 (0.2)<br />
* Baseline comparisons were made for the Orgogozo scale only.<br />
† Figures in parentheses are standard errors.<br />
31.5 (5.3)<br />
54.7 (5.3)<br />
50.3 (8.7)<br />
6.1 (0.7<br />
6.3 (0.7)<br />
3.2 (0.3)<br />
3.0 (0.3)<br />
Intervention less<br />
Comparison<br />
11.0 (7.4)<br />
18.2 (10.6)<br />
27.9 (10.8)<br />
–1.5 (0.9)<br />
–2.2 (1.0)<br />
–0.6 (0.4)<br />
–0.6 (0.4)<br />
Anderson et al 80 used a graded neurological examination scale that was sensitive to<br />
deficits referable to the region of the brain perfused by branches of the internal carotid<br />
artery. 83 A score of 100 was considered normal. Examinations were administered on<br />
enrolment, at five days, six weeks, four months (the primary outcome of interest), and<br />
one year.<br />
The authors report that comparison therapy patients improved by (Mean ± SEM) 15.9 ±<br />
3.2 points (p < 0.0003) while the intervention group experiences an improvement in<br />
scores by 12.2 ± 4.8 points (p < 0.03). Due to the trend of better improvement in the<br />
comparison group compared to the HBO-exposed group, the study was suspended for<br />
ethical reasons.<br />
48 <strong>Hyperbaric</strong> oxygen therapy<br />
p<br />
0.15<br />
0.10<br />
0.02<br />
0.19<br />
0.03<br />
0.13<br />
0.11