Habitat use and population dynamics of the Azure-Winged Magpie ...
Habitat use and population dynamics of the Azure-Winged Magpie ...
Habitat use and population dynamics of the Azure-Winged Magpie ...

Create successful ePaper yourself
Turn your PDF publications into a flip-book with our unique Google optimized e-Paper software.
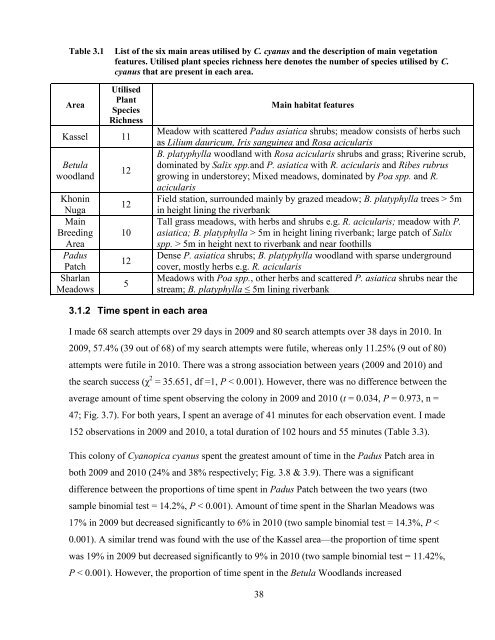
Table 3.1 List <strong>of</strong> <strong>the</strong> six main areas utilised by C. cyanus <strong>and</strong> <strong>the</strong> description <strong>of</strong> main vegetation<br />
features. Utilised plant species richness here denotes <strong>the</strong> number <strong>of</strong> species utilised by C.<br />
cyanus that are present in each area.<br />
Area<br />
Utilised<br />
Plant<br />
Species<br />
Richness<br />
Kassel 11<br />
Betula<br />
woodl<strong>and</strong><br />
Khonin<br />
Nuga<br />
Main<br />
Breeding<br />
Area<br />
Padus<br />
Patch<br />
Sharlan<br />
Meadows<br />
12<br />
12<br />
10<br />
12<br />
5<br />
3.1.2 Time spent in each area<br />
38<br />
Main habitat features<br />
Meadow with scattered Padus asiatica shrubs; meadow consists <strong>of</strong> herbs such<br />
as Lilium dauricum, Iris sanguinea <strong>and</strong> Rosa acicularis<br />
B. platyphylla woodl<strong>and</strong> with Rosa acicularis shrubs <strong>and</strong> grass; Riverine scrub,<br />
dominated by Salix spp.<strong>and</strong> P. asiatica with R. acicularis <strong>and</strong> Ribes rubrus<br />
growing in understorey; Mixed meadows, dominated by Poa spp. <strong>and</strong> R.<br />
acicularis<br />
Field station, surrounded mainly by grazed meadow; B. platyphylla trees > 5m<br />
in height lining <strong>the</strong> riverbank<br />
Tall grass meadows, with herbs <strong>and</strong> shrubs e.g. R. acicularis; meadow with P.<br />
asiatica; B. platyphylla > 5m in height lining riverbank; large patch <strong>of</strong> Salix<br />
spp. > 5m in height next to riverbank <strong>and</strong> near foothills<br />
Dense P. asiatica shrubs; B. platyphylla woodl<strong>and</strong> with sparse underground<br />
cover, mostly herbs e.g. R. acicularis<br />
Meadows with Poa spp., o<strong>the</strong>r herbs <strong>and</strong> scattered P. asiatica shrubs near <strong>the</strong><br />
stream; B. platyphylla ≤ 5m lining riverbank<br />
I made 68 search attempts over 29 days in 2009 <strong>and</strong> 80 search attempts over 38 days in 2010. In<br />
2009, 57.4% (39 out <strong>of</strong> 68) <strong>of</strong> my search attempts were futile, whereas only 11.25% (9 out <strong>of</strong> 80)<br />
attempts were futile in 2010. There was a strong association between years (2009 <strong>and</strong> 2010) <strong>and</strong><br />
<strong>the</strong> search success (χ 2 = 35.651, df =1, P < 0.001). However, <strong>the</strong>re was no difference between <strong>the</strong><br />
average amount <strong>of</strong> time spent observing <strong>the</strong> colony in 2009 <strong>and</strong> 2010 (t = 0.034, P = 0.973, n =<br />
47; Fig. 3.7). For both years, I spent an average <strong>of</strong> 41 minutes for each observation event. I made<br />
152 observations in 2009 <strong>and</strong> 2010, a total duration <strong>of</strong> 102 hours <strong>and</strong> 55 minutes (Table 3.3).<br />
This colony <strong>of</strong> Cyanopica cyanus spent <strong>the</strong> greatest amount <strong>of</strong> time in <strong>the</strong> Padus Patch area in<br />
both 2009 <strong>and</strong> 2010 (24% <strong>and</strong> 38% respectively; Fig. 3.8 & 3.9). There was a significant<br />
difference between <strong>the</strong> proportions <strong>of</strong> time spent in Padus Patch between <strong>the</strong> two years (two<br />
sample binomial test = 14.2%, P < 0.001). Amount <strong>of</strong> time spent in <strong>the</strong> Sharlan Meadows was<br />
17% in 2009 but decreased significantly to 6% in 2010 (two sample binomial test = 14.3%, P <<br />
0.001). A similar trend was found with <strong>the</strong> <strong>use</strong> <strong>of</strong> <strong>the</strong> Kassel area—<strong>the</strong> proportion <strong>of</strong> time spent<br />
was 19% in 2009 but decreased significantly to 9% in 2010 (two sample binomial test = 11.42%,<br />
P < 0.001). However, <strong>the</strong> proportion <strong>of</strong> time spent in <strong>the</strong> Betula Woodl<strong>and</strong>s increased