Habitat use and population dynamics of the Azure-Winged Magpie ...
Habitat use and population dynamics of the Azure-Winged Magpie ...
Habitat use and population dynamics of the Azure-Winged Magpie ...

You also want an ePaper? Increase the reach of your titles
YUMPU automatically turns print PDFs into web optimized ePapers that Google loves.
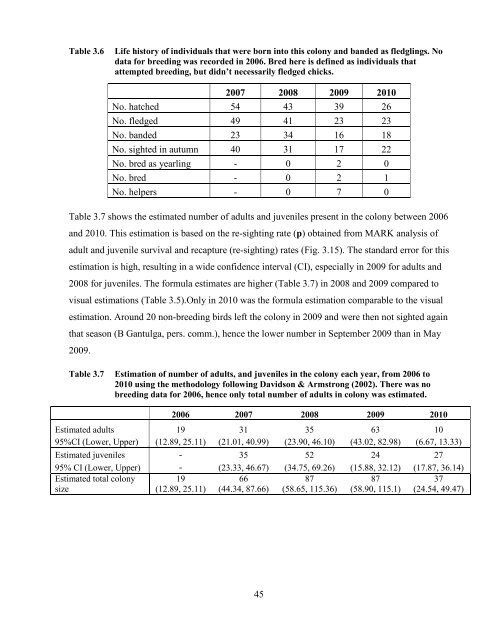
Table 3.6 Life history <strong>of</strong> individuals that were born into this colony <strong>and</strong> b<strong>and</strong>ed as fledglings. No<br />
data for breeding was recorded in 2006. Bred here is defined as individuals that<br />
attempted breeding, but didn’t necessarily fledged chicks.<br />
2007 2008 2009 2010<br />
No. hatched 54 43 39 26<br />
No. fledged 49 41 23 23<br />
No. b<strong>and</strong>ed 23 34 16 18<br />
No. sighted in autumn 40 31 17 22<br />
No. bred as yearling - 0 2 0<br />
No. bred - 0 2 1<br />
No. helpers - 0 7 0<br />
Table 3.7 shows <strong>the</strong> estimated number <strong>of</strong> adults <strong>and</strong> juveniles present in <strong>the</strong> colony between 2006<br />
<strong>and</strong> 2010. This estimation is based on <strong>the</strong> re-sighting rate (p) obtained from MARK analysis <strong>of</strong><br />
adult <strong>and</strong> juvenile survival <strong>and</strong> recapture (re-sighting) rates (Fig. 3.15). The st<strong>and</strong>ard error for this<br />
estimation is high, resulting in a wide confidence interval (CI), especially in 2009 for adults <strong>and</strong><br />
2008 for juveniles. The formula estimates are higher (Table 3.7) in 2008 <strong>and</strong> 2009 compared to<br />
visual estimations (Table 3.5).Only in 2010 was <strong>the</strong> formula estimation comparable to <strong>the</strong> visual<br />
estimation. Around 20 non-breeding birds left <strong>the</strong> colony in 2009 <strong>and</strong> were <strong>the</strong>n not sighted again<br />
that season (B Gantulga, pers. comm.), hence <strong>the</strong> lower number in September 2009 than in May<br />
2009.<br />
Table 3.7 Estimation <strong>of</strong> number <strong>of</strong> adults, <strong>and</strong> juveniles in <strong>the</strong> colony each year, from 2006 to<br />
2010 using <strong>the</strong> methodology following Davidson & Armstrong (2002). There was no<br />
breeding data for 2006, hence only total number <strong>of</strong> adults in colony was estimated.<br />
2006 2007 2008 2009 2010<br />
Estimated adults 19 31 35 63 10<br />
95%CI (Lower, Upper) (12.89, 25.11) (21.01, 40.99) (23.90, 46.10) (43.02, 82.98) (6.67, 13.33)<br />
Estimated juveniles - 35 52 24 27<br />
95% CI (Lower, Upper) - (23.33, 46.67) (34.75, 69.26) (15.88, 32.12) (17.87, 36.14)<br />
Estimated total colony<br />
size<br />
19<br />
(12.89, 25.11)<br />
66<br />
(44.34, 87.66)<br />
45<br />
87<br />
(58.65, 115.36)<br />
87<br />
(58.90, 115.1)<br />
37<br />
(24.54, 49.47)