Soil Management Handbook - Ministry of Agriculture and Lands
Soil Management Handbook - Ministry of Agriculture and Lands
Soil Management Handbook - Ministry of Agriculture and Lands

You also want an ePaper? Increase the reach of your titles
YUMPU automatically turns print PDFs into web optimized ePapers that Google loves.
Table 12<br />
Availability Coefficients<br />
Crop Coefficient<br />
Peas 0.35<br />
Potatoes 0.35<br />
Tree Fruits 0.40<br />
Grapes 0.40<br />
Tomatoes 0.40<br />
All other crops until other<br />
data available<br />
0.50<br />
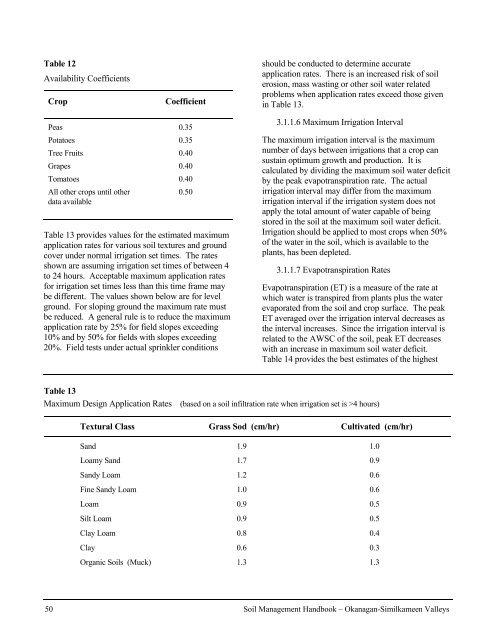
Table 13 provides values for the estimated maximum<br />
application rates for various soil textures <strong>and</strong> ground<br />
cover under normal irrigation set times. The rates<br />
shown are assuming irrigation set times <strong>of</strong> between 4<br />
to 24 hours. Acceptable maximum application rates<br />
for irrigation set times less than this time frame may<br />
be different. The values shown below are for level<br />
ground. For sloping ground the maximum rate must<br />
be reduced. A general rule is to reduce the maximum<br />
application rate by 25% for field slopes exceeding<br />
10% <strong>and</strong> by 50% for fields with slopes exceeding<br />
20%. Field tests under actual sprinkler conditions<br />
should be conducted to determine accurate<br />
application rates. There is an increased risk <strong>of</strong> soil<br />
erosion, mass wasting or other soil water related<br />
problems when application rates exceed those given<br />
in Table 13.<br />
3.1.1.6 Maximum Irrigation Interval<br />
The maximum irrigation interval is the maximum<br />
number <strong>of</strong> days between irrigations that a crop can<br />
sustain optimum growth <strong>and</strong> production. It is<br />
calculated by dividing the maximum soil water deficit<br />
by the peak evapotranspiration rate. The actual<br />
irrigation interval may differ from the maximum<br />
irrigation interval if the irrigation system does not<br />
apply the total amount <strong>of</strong> water capable <strong>of</strong> being<br />
stored in the soil at the maximum soil water deficit.<br />
Irrigation should be applied to most crops when 50%<br />
<strong>of</strong> the water in the soil, which is available to the<br />
plants, has been depleted.<br />
3.1.1.7 Evapotranspiration Rates<br />
Evapotranspiration (ET) is a measure <strong>of</strong> the rate at<br />
which water is transpired from plants plus the water<br />
evaporated from the soil <strong>and</strong> crop surface. The peak<br />
ET averaged over the irrigation interval decreases as<br />
the interval increases. Since the irrigation interval is<br />
related to the AWSC <strong>of</strong> the soil, peak ET decreases<br />
with an increase in maximum soil water deficit.<br />
Table 14 provides the best estimates <strong>of</strong> the highest<br />
Table 13<br />
Maximum Design Application Rates (based on a soil infiltration rate when irrigation set is >4 hours)<br />
Textural Class Grass Sod (cm/hr) Cultivated (cm/hr)<br />
S<strong>and</strong> 1.9 1.0<br />
Loamy S<strong>and</strong> 1.7 0.9<br />
S<strong>and</strong>y Loam 1.2 0.6<br />
Fine S<strong>and</strong>y Loam 1.0 0.6<br />
Loam 0.9 0.5<br />
Silt Loam 0.9 0.5<br />
Clay Loam 0.8 0.4<br />
Clay 0.6 0.3<br />
Organic <strong>Soil</strong>s (Muck) 1.3 1.3<br />
50 <strong>Soil</strong> <strong>Management</strong> <strong>H<strong>and</strong>book</strong> – Okanagan-Similkameen Valleys