

X-Ray Fluorescence Analytical Techniques - CNSTN : Centre ...
X-Ray Fluorescence Analytical Techniques - CNSTN : Centre ...
X-Ray Fluorescence Analytical Techniques - CNSTN : Centre ...

Create successful ePaper yourself
Turn your PDF publications into a flip-book with our unique Google optimized e-Paper software.
A widely used method is non-linear least squares fitting of the spectral data with an<br />
analytical function. This algebraic function, including all important parameters, such as the<br />
net areas of the fluorescent lines, their energy, resolution, etc., is used as a model for the<br />
measured spectrum. It will consist of the contribution from all peaks (modified Gaussian<br />
peaks, with corrections for low-energy tailing, escape peaks, etc.) within a certain region of<br />
interest and the background (described by, for example, linear or exponential polynomials).<br />
The optimum values of the parameters are those for which the difference between the model<br />
and the measured spectrum is minimal. Unfortunately some of these parameters are nonlinear,<br />
which places some importance on the minimization procedure (usually the Marquardt<br />
algorithm is used).<br />
In another frequently used approach the discrete deconvolutions of a spectrum with a<br />
so-called top-hat filter suppresses the low-frequency component, i.e. the slowly varying<br />
background. A severe distortion of the peaks is introduced. But applying this filter to both the<br />
unknown spectrum and well defined, experimentally obtained, reference spectra, a multiple<br />
linear least-squares fitting to the filtered spectra will result in the net peak areas of interest. A<br />
disadvantage of this method is that reference and unknown spectra should be acquired under<br />
preferably identical conditions; especially, energy calibration changes of<br />
more than only few e can generate large systematic errors.<br />
IV. Detector Artefacts<br />
IV.1 Escape Peaks<br />
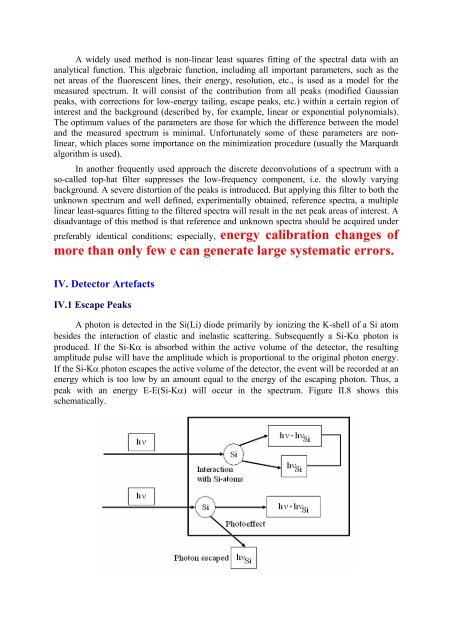
A photon is detected in the Si(Li) diode primarily by ionizing the K-shell of a Si atom<br />
besides the interaction of elastic and inelastic scattering. Subsequently a Si-Kα photon is<br />
produced. If the Si-Kα is absorbed within the active volume of the detector, the resulting<br />
amplitude pulse will have the amplitude which is proportional to the original photon energy.<br />
If the Si-Kα photon escapes the active volume of the detector, the event will be recorded at an<br />
energy which is too low by an amount equal to the energy of the escaping photon. Thus, a<br />
peak with an energy E-E(Si-Kα) will occur in the spectrum. Figure II.8 shows this<br />
schematically.