

X-Ray Fluorescence Analytical Techniques - CNSTN : Centre ...
X-Ray Fluorescence Analytical Techniques - CNSTN : Centre ...
X-Ray Fluorescence Analytical Techniques - CNSTN : Centre ...

You also want an ePaper? Increase the reach of your titles
YUMPU automatically turns print PDFs into web optimized ePapers that Google loves.
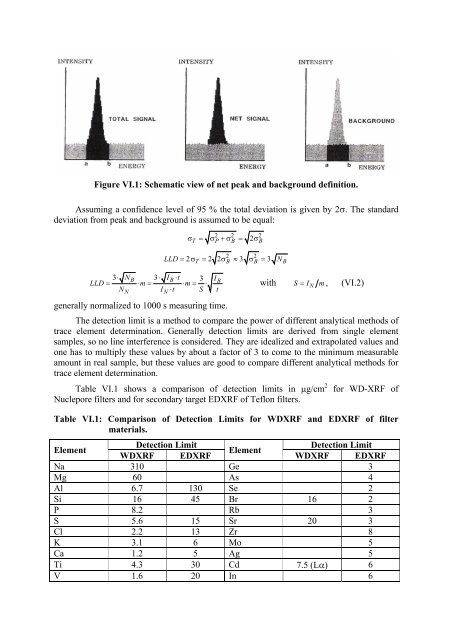
Figure VI.1: Schematic view of net peak and background definition.<br />
Assuming a confidence level of 95 % the total deviation is given by 2σ. The standard<br />
deviation from peak and background is assumed to be equal:<br />
3⋅ NB 3⋅ IB⋅t 3 I<br />
LLD = ⋅ m = ⋅ m = ⋅ B<br />
NN IN ⋅t<br />
S t<br />
2 2 2<br />
σ T = σ P +σ B = 2σ<br />
B<br />
2 2<br />
LLD = 2σ T = 2 2σB ≈3 σ B = 3 NB<br />
with S = INm, (VI.2)<br />
generally normalized to 1000 s measuring time.<br />
The detection limit is a method to compare the power of different analytical methods of<br />
trace element determination. Generally detection limits are derived from single element<br />
samples, so no line interference is considered. They are idealized and extrapolated values and<br />
one has to multiply these values by about a factor of 3 to come to the minimum measurable<br />
amount in real sample, but these values are good to compare different analytical methods for<br />
trace element determination.<br />
Table VI.1 shows a comparison of detection limits in µg/cm 2 for WD-XRF of<br />
Nuclepore filters and for secondary target EDXRF of Teflon filters.<br />
Table VI.1: Comparison of Detection Limits for WDXRF and EDXRF of filter<br />
materials.<br />
Detection Limit Detection Limit<br />
Element<br />
Element<br />
WDXRF EDXRF<br />
WDXRF EDXRF<br />
Na 310 Ge 3<br />
Mg 60 As 4<br />
Al 6.7 130 Se 2<br />
Si 16 45 Br 16 2<br />
P 8.2 Rb 3<br />
S 5.6 15 Sr 20 3<br />
Cl 2.2 13 Zr 8<br />
K 3.1 6 Mo 5<br />
Ca 1.2 5 Ag 5<br />
Ti 4.3 30 Cd 7.5 (Lα) 6<br />
V 1.6 20 In 6