- Page 1 and 2:
THE LOCAL TRANSPORT PLAN 2001 - 200
- Page 3 and 4:
II Chairman’s Foreword The Govern
- Page 5 and 6:
IV 5. Six Bus Quality Partnerships
- Page 7 and 8:
VI CONTENTS CHAPTER 1 - STRATEGIC I
- Page 9 and 10:
VIII CHAPTER 4 - CYCLING STRATEGY 7
- Page 11 and 12:
X CHAPTER 12 - PARKING STRATEGY 144
- Page 13 and 14:
XII CHAPTER 19 ROAD SCHEMES MAJOR &
- Page 15 and 16:
XIV Public Transport 260 Staff Reso
- Page 17 and 18:
Chapter 1 - Strategic Influences 2
- Page 19 and 20:
Chapter 1 - Strategic Influences 4
- Page 21 and 22:
Chapter 1 - Strategic Influences 6
- Page 23 and 24:
Chapter 1 - Strategic Influences 8
- Page 25 and 26:
Chapter 1 - Strategic Influences 10
- Page 27 and 28:
Chapter 1 - Strategic Influences 12
- Page 29 and 30:
Chapter 2 - Setting the Scene 14 Ch
- Page 31 and 32:
Chapter 2 - Setting the Scene 16 Ou
- Page 33 and 34:
Chapter 2 - Setting the Scene 18 Ma
- Page 35 and 36:
Chapter 2 - Setting the Scene 20 Na
- Page 37 and 38:
Chapter 2 - Setting the Scene 22 Fr
- Page 39 and 40:
Chapter 2 - Setting the Scene 24 Pr
- Page 41 and 42:
Chapter 2 - Setting the Scene 26 Ta
- Page 43 and 44:
Chapter 2 - Setting the Scene 28 Pu
- Page 45 and 46:
Chapter 2 - Setting the Scene 30 So
- Page 47 and 48:
Chapter 2 - Setting the Scene 32 Pr
- Page 49 and 50:
Chapter 2 - Setting the Scene 34 Co
- Page 51 and 52:
Chapter 2 - Setting the Scene 36 Pr
- Page 53 and 54:
Chapter 2 - Setting the Scene 38
- Page 55 and 56:
Chapter 3 - Integrated Public Trans
- Page 57 and 58:
Chapter 3 - Integrated Public Trans
- Page 59 and 60:
Chapter 3 - Integrated Public Trans
- Page 61 and 62:
Chapter 3 - Integrated Public Trans
- Page 63 and 64:
Chapter 3 - Integrated Public Trans
- Page 65 and 66:
Chapter 3 - Integrated Public Trans
- Page 67 and 68:
Chapter 3 - Integrated Public Trans
- Page 69 and 70:
Chapter 3 - Integrated Public Trans
- Page 71 and 72:
Chapter 3 - Integrated Public Trans
- Page 73 and 74:
Chapter 3 - Integrated Public Trans
- Page 75 and 76:
Chapter 3 - Integrated Public Trans
- Page 77 and 78:
Chapter 3 - Integrated Public Trans
- Page 79 and 80:
Chapter 3 - Integrated Public Trans
- Page 81 and 82:
Chapter 3 - Integrated Public Trans
- Page 83 and 84:
Chapter 3 - Integrated Public Trans
- Page 85 and 86:
Chapter 3 - Integrated Public Trans
- Page 87 and 88:
Chapter 3 - Integrated Public Trans
- Page 89 and 90:
Chapter 4 - Cycling Strategy 74 CHA
- Page 91 and 92:
Chapter 4 - Cycling Strategy 76 ●
- Page 93 and 94:
Chapter 4 - Cycling Strategy 78 Tra
- Page 95 and 96:
Chapter 5 - Walking Strategy 80 Cha
- Page 97 and 98:
Chapter 5 - Walking Strategy 82 The
- Page 99 and 100:
Chapter 5 - Walking Strategy 84 Lan
- Page 101 and 102:
Chapter 5 - Walking Strategy 86 imp
- Page 103 and 104:
Chapter 6 - School Travel Plans 88
- Page 105 and 106:
Chapter 6 - School Travel Plans 90
- Page 107 and 108:
Chapter 6 - School Travel Plans 92
- Page 109 and 110:
Chapter 6 - School Travel Plans 94
- Page 111 and 112:
Chapter 6 - School Travel Plans 96
- Page 113 and 114:
Chapter 7 - Employers Travel Plans
- Page 115 and 116:
Chapter 7 - Employers Travel Plans
- Page 117 and 118:
Chapter 7 - Employers Travel Plans
- Page 119 and 120:
Chapter 7 - Employers Travel Plans
- Page 121 and 122:
Chapter 7 - Employers Travel Plans
- Page 123 and 124:
Chapter 8 - TravelWise 108 Chapter
- Page 125 and 126:
Chapter 8 - TravelWise 110
- Page 127 and 128:
112 Chapter 9 - Road Safety Plan In
- Page 129 and 130:
Chapter 9 - Road Safety Plan 114 Pr
- Page 131 and 132:
Chapter 9 - Road Safety Plan 116 Dr
- Page 133 and 134:
Chapter 9 - Road Safety Plan 118 Cl
- Page 135 and 136:
Chapter 9 - Road Safety Plan 120 Ta
- Page 137 and 138:
Chapter 9 - Road Safety Plan 122 Sl
- Page 139 and 140:
Chapter 9 - Road Safety Plan 124 Ta
- Page 141 and 142:
Chapter 9 - Road Safety Plan 126 Ta
- Page 143 and 144:
Chapter 9 - Road Safety Plan 128 An
- Page 145 and 146:
Chapter 9 - Road Safety Plan 130 To
- Page 147 and 148:
Chapter 9 - Road Safety Plan 132 Ag
- Page 149 and 150:
Chapter 9 - Road Safety Plan 134
- Page 151 and 152:
Chapter 10 - Other Safety Initiativ
- Page 153 and 154:
Chapter 10 - Other Safety Initiativ
- Page 155 and 156:
Chapter 10 - Other Safety Initiativ
- Page 157 and 158:
Chapter 11 - Road Traffic Reduction
- Page 159 and 160:
Chapter 12 - Parking Strategy 144 C
- Page 161 and 162:
Chapter 13 - Local Air Quality Mana
- Page 163 and 164:
Chapter 13 - Local Air Quality Mana
- Page 165 and 166:
Chapter 13 - Local Air Quality Mana
- Page 167 and 168:
Chapter 13 - Local Air Quality Mana
- Page 169 and 170:
Chapter 13 - Local Air Quality Mana
- Page 171 and 172:
Chapter 13 - Local Air Quality Mana
- Page 173 and 174:
Chapter 14 - Cleaner / Greener Vehi
- Page 175 and 176:
Chapter 15 - Intelligent Transport
- Page 177 and 178:
Chapter 16 - Freight Strategy 162 C
- Page 179 and 180:
Chapter 16 - Freight Strategy 164 R
- Page 181 and 182:
Chapter 16 - Freight Strategy 166 N
- Page 183 and 184:
Chapter 16 - Freight Strategy 168 R
- Page 185 and 186:
Chapter 16 - Freight Strategy 170 I
- Page 187 and 188:
Chapter 16 - Freight Strategy 172 T
- Page 189 and 190:
Chapter 16 - Freight Strategy 174
- Page 191 and 192:
Chapter 17 - Highway Maintenance 17
- Page 193 and 194:
Chapter 17 - Highway Maintenance 17
- Page 195 and 196:
Chapter 17 - Highway Maintenance 18
- Page 197 and 198:
Chapter 17 - Highway Maintenance 18
- Page 199 and 200:
Chapter 17 - Highway Maintenance 18
- Page 201 and 202:
Chapter 17 - Highway Maintenance 18
- Page 203 and 204:
Chapter 17 - Highway Maintenance 18
- Page 205 and 206:
Chapter 17 - Highway Maintenance 19
- Page 207 and 208:
Chapter 17 - Highway Maintenance 19
- Page 209 and 210:
Chapter 17 - Highway Maintenance 19
- Page 211 and 212:
Chapter 17 - Highway Maintenance 19
- Page 213 and 214:
Chapter 18 - Bridges 198 Chapter 18
- Page 215 and 216:
Chapter 18 - Bridges 200 The 2001/2
- Page 217 and 218:
Chapter 18 - Bridges 202 A recent r
- Page 219 and 220:
Chapter 18 - Bridges 204 5819 Stati
- Page 221 and 222:
Chapter 18 - Bridges 206 Fladbury R
- Page 223 and 224:
Chapter 18 - Bridges 208 Husum Way
- Page 225 and 226:
Chapter 18 - Bridges 210 PRN: Princ
- Page 227 and 228:
Chapter 18 - Bridges 212
- Page 229 and 230:
Chapter 19 Road Schemes Major & Min
- Page 231 and 232:
Chapter 19 Road Schemes Major & Min
- Page 233 and 234:
Chapter 19 Road Schemes Major & Min
- Page 235 and 236:
Chapter 20 - Core and Non Core Trun
- Page 237 and 238:
Chapter 20 - Core and Non Core Trun
- Page 239 and 240:
Chapter 20 - Core and Non Core Trun
- Page 241 and 242:
Chapter 21 - Other Transport Studie
- Page 243 and 244:
Chapter 22 - Worcester City Package
- Page 245 and 246:
Chapter 22 - Worcester City Package
- Page 247 and 248:
Chapter 22 - Worcester City Package
- Page 249 and 250:
Chapter 22 - Worcester City Package
- Page 251 and 252:
Chapter 22 - Worcester City Package
- Page 253 and 254:
Chapter 22 - Worcester City Package
- Page 255 and 256: Chapter 23 - Northern Towns 240 Cha
- Page 257 and 258: Chapter 23 - Northern Towns 242 The
- Page 259 and 260: Chapter 23 - Northern Towns 244 Bro
- Page 261 and 262: Chapter 24 - Rural Worcestershire 2
- Page 263 and 264: Chapter 24 - Rural Worcestershire 2
- Page 265 and 266: Chapter 25 - Wider Policy Areas 250
- Page 267 and 268: Chapter 25 - Wider Policy Areas 252
- Page 269 and 270: Chapter 25 - Wider Policy Areas 254
- Page 271 and 272: Chapter 26 - Summary of the Bid 256
- Page 273 and 274: Chapter 26 - Summary of the Bid 258
- Page 275 and 276: Chapter 26 - Summary of the Bid 260
- Page 277 and 278: Chapter 26 - Summary of the Bid 262
- Page 279 and 280: Chapter 26 - Summary of the Bid 264
- Page 281 and 282: Chapter 26 - Summary of the Bid 266
- Page 283 and 284: Chapter 26 - Summary of the Bid 268
- Page 285 and 286: Chapter 26 - Summary of the Bid 270
- Page 287 and 288: Chapter 26 - Summary of the Bid 272
- Page 289 and 290: Chapter 26 - Summary of the Bid 274
- Page 291 and 292: Chapter 27 - Monitoring 276 Chapter
- Page 293 and 294: Chapter 27 - Monitoring 278 Nationa
- Page 295 and 296: Chapter 27 - Monitoring 280 iv) To
- Page 297 and 298: Chapter 27 - Monitoring 282 11) To
- Page 299 and 300: Chapter 27 - Monitoring 284 5) To p
- Page 301 and 302: Chapter 27 - Monitoring 286 * - Mor
- Page 303 and 304: Chapter 27 - Monitoring 288 6) Incr
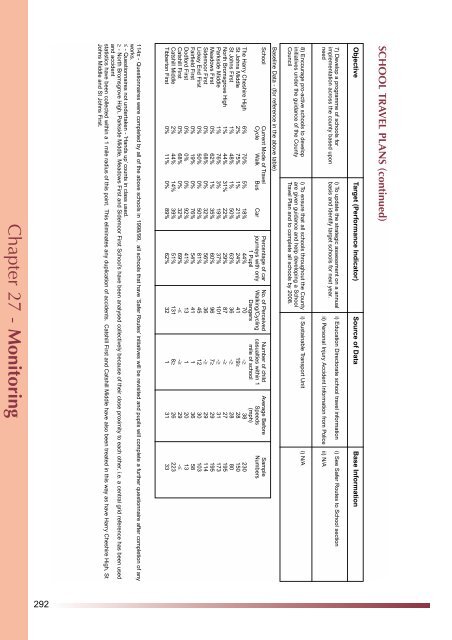
- Page 305: Chapter 27 - Monitoring 290 9) To p
- Page 309 and 310: Chapter 27 - Monitoring 294 5) To i
- Page 311 and 312: Chapter 27 - Monitoring 296 6) To e
- Page 313 and 314: Chapter 27 - Monitoring 298 1) To r
- Page 315 and 316: Chapter 27 - Monitoring 300 ii) All
- Page 317 and 318: Chapter 27 - Monitoring 302 iii) Co
- Page 319 and 320: Chapter 27 - Monitoring 304 Reliabi
- Page 321 and 322: Chapter 27 - Monitoring 306 Securit
- Page 323 and 324: Chapter 27 - Monitoring 308