Integrated Public Transport Strategy - Worcestershire County Council
Integrated Public Transport Strategy - Worcestershire County Council
Integrated Public Transport Strategy - Worcestershire County Council

Create successful ePaper yourself
Turn your PDF publications into a flip-book with our unique Google optimized e-Paper software.
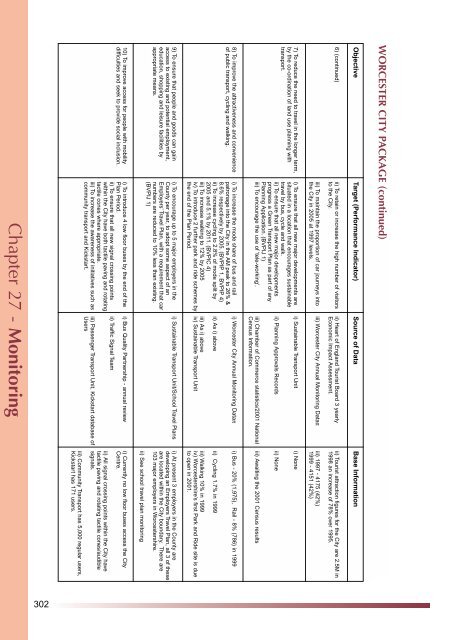
Chapter 27 - Monitoring<br />
302<br />
iii) Community <strong>Transport</strong> has 5,000 regular users,<br />
Kickstart has 171 users.<br />
10) To improve access for people with mobility<br />
difficulties and seek to provide social inclusion.<br />
i) To introduce 4 low floor buses by the end of the<br />
Plan Period.<br />
ii) To ensure that all new signal crossing points<br />
within the City have both tactile paving and rotating<br />
tactile cones where appropriate.<br />
iii) To increase the awareness of initiatives such as<br />
community transport and Kickstart.<br />
iii) Passenger <strong>Transport</strong> Unit, Kickstart database of<br />
Users<br />
ii) All signal crossing points within the City have<br />
tactile paving and rotating tactile cones/audible<br />
signals.<br />
ii) Traffic Signal Team<br />
i) Bus Quality Partnership - annual review<br />
i) Currently no low floor buses access the City<br />
Centre.<br />
ii) See school travel plan monitoring<br />
9) To ensure that people and goods can gain<br />
access to existing and potential employment,<br />
education, shopping and leisure facilities by<br />
appropriate means.<br />
i) To encourage up to 5 major employers in the<br />
<strong>County</strong> per year, to adopt some aspect of an<br />
Employers’ Travel Plan, with a requirement that car<br />
numbers are reduced to 10% less than existing.<br />
(BVPIJ 1)<br />
i) Sustainable <strong>Transport</strong> Unit/School Travel Plans i) At present 3 employers in the <strong>County</strong> are<br />
developing an Employers Travel Plan, all 3 of these<br />
are located within the City boundary. There are<br />
103 major employers in <strong>Worcestershire</strong>.<br />
8) To improve the attractiveness and convenience<br />
of public transport, cycling and walking.<br />
i) To increase the mode share of bus and rail<br />
patronage into the City in the AM peak to 26% &<br />
8.6% respectively by 2005. (BVPIP 1, BVPIP 4)<br />
ii) To increase cycling to 2.8% of mode split by<br />
2005 and 5.1% by 2011. (BVPIC 4)<br />
iii) To increase walking to 12% by 2005<br />
iv) To introduce 2 further park and ride schemes by<br />
the end of the Plan Period.<br />
iii) As i) above<br />
iv) Sustainable <strong>Transport</strong> Unit<br />
iii) Walking 10% in 1999<br />
iv) <strong>Worcestershire</strong>’s first Park and Ride site is due<br />
to open in 2001.<br />
ii) As i) above<br />
ii) Cycling 1.7% in 1999<br />
i) Worcester City Annual Monitoring Dataπ<br />
i) Bus - 20% (1,975), Rail - 8% (786) in 1999<br />
7) To reduce the need to travel in the longer term,<br />
by the co-ordination of land use planning with<br />
transport.<br />
i) To ensure that all new major developments are<br />
situated in a location that encourages sustainable<br />
travel by bus, cycle and walk.<br />
ii) To ensure that all new major developments<br />
progress a Green <strong>Transport</strong> Plan as part of any<br />
Planning Application. (BVPIJ 1)<br />
iii) To encourage the use of ‘tele-working’.<br />
iii) Chamber of Commerce statistics/2001 National<br />
Census Information.<br />
iii) Awaiting the 2001 Census results<br />
ii) Planning Approvals Records<br />
ii) None<br />
i) Sustainable <strong>Transport</strong> Unit<br />
i) None<br />
iii) To maintain the proportion of car journeys into<br />
the City in 2005 at 1997 levels.<br />
iii) Worcester City Annual Monitoring Dataπ<br />
iii) 1997 - 4175 (42%)<br />
1999 - 4151 (42%)<br />
6) (continued)<br />
ii) To retain or increase the high number of visitors<br />
to the City.<br />
ii) Heart of England Tourist Board 3 yearly<br />
Economic Impact Assessment.<br />
ii) Tourist attraction figures for the City are 2.5M in<br />
1998 an increase of 78% over 1995.<br />
Objective<br />
Target (Performance Indicator) Source of Data Base Information<br />
WORCESTER CITY PACKAGE (continued)