Vol. 15 - Deutsches Primatenzentrum
Vol. 15 - Deutsches Primatenzentrum
Vol. 15 - Deutsches Primatenzentrum

You also want an ePaper? Increase the reach of your titles
YUMPU automatically turns print PDFs into web optimized ePapers that Google loves.
Page 62 Lemur News <strong>Vol</strong>. <strong>15</strong>, 2010<br />
Frequency<br />
Frequency<br />
Frequency<br />
Frequency<br />
Frequency<br />
Frequency<br />
Frequency<br />
0,4<br />
0,3<br />
0,2<br />
0,1<br />
0<br />
0,4<br />
0,3<br />
0,2<br />
0,1<br />
0<br />
0,4<br />
0,3<br />
0,2<br />
0,1<br />
0<br />
0,4<br />
0,3<br />
0,2<br />
0,1<br />
0<br />
0,4<br />
0,3<br />
0,2<br />
0,1<br />
0<br />
0,4<br />
0,3<br />
0,2<br />
0,1<br />
0<br />
0,4<br />
0,3<br />
0,2<br />
0,1<br />
0<br />
Anjanaharibe-Sud<br />
-0,5 -0,3 -0,1 0,1 0,3 0,5 0,7 0,9<br />
Relationship Coefficients<br />
Morontandrano<br />
-0,5 -0,3 -0,1 0,1 0,3 0,5 0,7 0,9<br />
Relationship Coefficients<br />
Ambatovaky<br />
-0,5 -0,3 -0,1 0,1 0,3 0,5 0,7 0,9<br />
Relationship Coefficients<br />
Zahamena<br />
-0,5 -0,3 -0,1 0,1 0,3 0,5 0,7 0,9<br />
Relationship Coefficients<br />
Betampona<br />
-0,5 -0,3 -0,1 0,1 0,3 0,5 0,7 0,9<br />
Relationship Coefficients<br />
Anjozorobe<br />
-0,5 -0,3 -0,1 0,1 0,3 0,5 0,7 0,9<br />
Relationship Coefficients<br />
Mantadia<br />
-0,5 -0,3 -0,1 0,1 0,3 0,5 0,7 0,9<br />
Relationship Coefficients<br />
Frequency<br />
Frequency<br />
Frequency<br />
0,4<br />
0,3<br />
0,2<br />
0,1<br />
0<br />
0,4<br />
0,3<br />
0,2<br />
0,1<br />
0<br />
0,4<br />
0,3<br />
0,2<br />
0,1<br />
0<br />
Andasibe<br />
-0,5 -0,3 -0,1 0,1 0,3 0,5 0,7 0,9<br />
Relationship Coefficients<br />
Maromizaha<br />
-0,5 -0,3 -0,1 0,1 0,3 0,5 0,7 0,9<br />
Relationship Coefficients<br />
Anosibe an'ala<br />
-0,5 -0,3 -0,1 0,1 0,3 0,5 0,7 0,9<br />
Relationship Coefficients<br />
Parent-Offspring Full Sibling Half Sibling<br />
Unrelated All Populations<br />
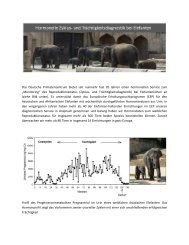
Fig. 4: Distributions of relationship coefficients estimated in<br />
each population overlaid on a simulation of 10,000 known<br />
genotypes and pedigreed relationships (Queller and Goodnight,<br />
1989).<br />
a significantly high FIS estimate. Considering relationship<br />
among the samples as one manner of capturing inbreeding,all<br />
populations show some degree of relationship above what<br />
would be expected if the sampled individuals were unrelated.<br />
This is not surprising since samples were collected as found<br />
and this could include individuals that are members of a family<br />
group which is supported by the relationship coefficient<br />
distributions in Fig. 2.<br />
All populations demonstrated some degree of recent reduction<br />
in the effective population sizes.The bottlenecks did not<br />
appear to have been a single global event as different populations<br />
showed differing degrees to which the bottlenecks<br />
were detected. Using Lawler’s (2008) 4*Neb*generations,<br />
the bottlenecks detected would have had an expected window<br />
of occurrence of up to 250 to 800 years ago, within the<br />
timeframe of human encroachment. Hence, we postulate<br />
that among other things, anthropogenic disturbances,<br />
whether habitat destruction or subsistence hunting, may<br />
have influenced the demographic reduction that we detected<br />
in the bottleneck test. These baseline values could be useful<br />
in long-term or future studies to determine genetic health<br />
trends over time under various forest or habitat conditions.<br />
Genetic diversity is considered to be the most important<br />
factor in determining the genetic health of a species or population.Among<br />
the lemurs,there is little information in the literature<br />
that addresses the genetic diversity estimations for<br />
multiple populations of a given species. Ranaivoarisoa et al.<br />
(2010) found the observed heterozygosity in three of four<br />
Eulemur collaris populations to be higher than the expected<br />
heterozygosity. In E. coronatus, Ramanamahefa et al. (2010a)