

2011 Annual Report - SBM Offshore
2011 Annual Report - SBM Offshore
2011 Annual Report - SBM Offshore

You also want an ePaper? Increase the reach of your titles
YUMPU automatically turns print PDFs into web optimized ePapers that Google loves.
Powered by TCPDF (www.tcpdf.org)<br />
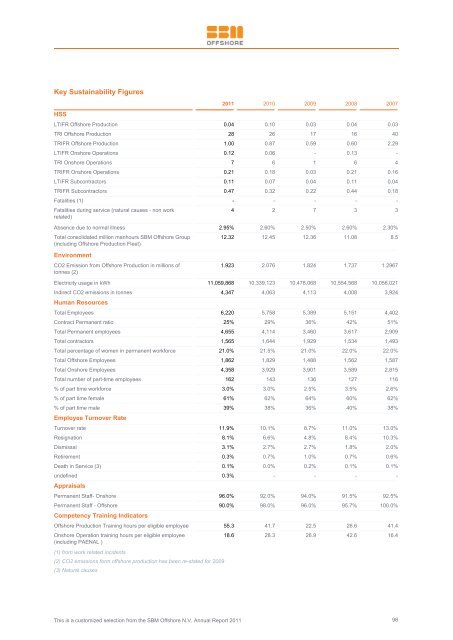
Key Sustainability Figures<br />
HSS<br />
<strong>2011</strong> 2010 2009 2008 2007<br />
LTIFR <strong>Offshore</strong> Production 0.04 0.10 0.03 0.04 0.03<br />
TRI <strong>Offshore</strong> Production 28 26 17 16 40<br />
TRIFR <strong>Offshore</strong> Production 1.00 0.87 0.59 0.60 2.29<br />
LTIFR Onshore Operations 0.12 0.06 - 0.13 -<br />
TRI Onshore Operations 7 6 1 6 4<br />
TRIFR Onshore Operations 0.21 0.18 0.03 0.21 0.16<br />
LTIFR Subcontractors 0.11 0.07 0.04 0.11 0.04<br />
TRIFR Subcontractors 0.47 0.32 0.22 0.44 0.18<br />
Fatalities (1) - - - - -<br />
Fatalities during service (natural causes - non work<br />
related)<br />
4 2 7 3 3<br />
Absence due to normal illness 2.95% 2.60% 2.50% 2.60% 2.30%<br />
Total consolidated million manhours <strong>SBM</strong> <strong>Offshore</strong> Group<br />
(including <strong>Offshore</strong> Production Fleet)<br />
Environment<br />
CO2 Emission from <strong>Offshore</strong> Production in millions of<br />
tonnes (2)<br />
12.32 12.45 12.36 11.08 8.5<br />
1.923 2.076 1.824 1.737 1.2967<br />
Electricity usage in kWh 11,059,868 10,339,123 10,478,068 10,554,568 10,056,021<br />
Indirect CO2 emissions in tonnes 4,347 4,063 4,113 4,008 3,924<br />
Human Resources<br />
Total Employees 6,220 5,758 5,389 5,151 4,402<br />
Contract Permanent ratio 25% 29% 36% 42% 51%<br />
Total Permanent employees 4,655 4,114 3,460 3,617 2,909<br />
Total contractors 1,565 1,644 1,929 1,534 1,493<br />
Total percentage of women in permanent workforce 21.0% 21.5% 21.0% 22.0% 22.0%<br />
Total <strong>Offshore</strong> Employees 1,862 1,829 1,488 1,562 1,587<br />
Total Onshore Employees 4,358 3,929 3,901 3,589 2,815<br />
Total number of part-time employees 162 143 136 127 116<br />
% of part time workforce 3.0% 3.0% 2.5% 3.5% 2.6%<br />
% of part time female 61% 62% 64% 60% 62%<br />
% of part time male 39% 38% 36% 40% 38%<br />
Employee Turnover Rate<br />
Turnover rate 11.9% 10.1% 8.7% 11.0% 13.0%<br />
Resignation 8.1% 6.6% 4.8% 8.4% 10.3%<br />
Dismissal 3.1% 2.7% 2.7% 1.8% 2.0%<br />
Retirement 0.3% 0.7% 1.0% 0.7% 0.6%<br />
Death in Service (3) 0.1% 0.0% 0.2% 0.1% 0.1%<br />
undefined 0.3% - - - -<br />
Appraisals<br />
Permanent Staff- Onshore 96.0% 92.0% 94.0% 91.5% 92.5%<br />
Permanent Staff - <strong>Offshore</strong> 90.0% 98.0% 96.0% 95.7% 100.0%<br />
Competency Training Indicators<br />
<strong>Offshore</strong> Production Training hours per eligible employee 55.3 41.7 22.5 26.6 41.4<br />
Onshore Operation training hours per eligible employee<br />
(including PAENAL )<br />
(1) from work related incidents<br />
(2) CO2 emissions form offshore production has been re-stated for 2009<br />
(3) Natural causes<br />
This is a customized selection from the <strong>SBM</strong> <strong>Offshore</strong> N.V. <strong>Annual</strong> <strong>Report</strong> <strong>2011</strong><br />
18.6 28.3 26.9 42.6 16.4<br />
98


