

2011 Annual Report - SBM Offshore
2011 Annual Report - SBM Offshore
2011 Annual Report - SBM Offshore

You also want an ePaper? Increase the reach of your titles
YUMPU automatically turns print PDFs into web optimized ePapers that Google loves.
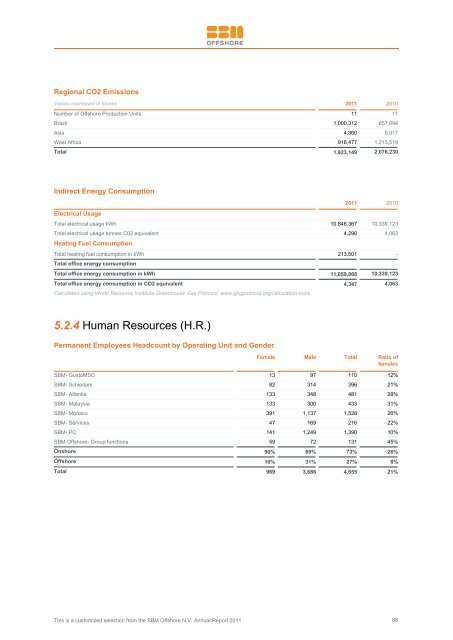
Regional CO2 Emissions<br />
Values expressed in tonnes <strong>2011</strong> 2010<br />
Number of <strong>Offshore</strong> Production Units 11 11<br />
Brazil 1,000,312 857,694<br />
Asia 4,360 5,017<br />
West Africa 918,477 1,213,519<br />
Total 1,923,149 2,076,230<br />
Indirect Energy Consumption<br />
Electrical Usage<br />
<strong>2011</strong> 2010<br />
Total electrical usage kWh 10,846,367 10,339,123<br />
Total electrical usage tonnes C02 equivalent 4,290 4,063<br />
Heating Fuel Consumption<br />
Total heating fuel consumption in kWh 213,501 -<br />
Total office energy consumption<br />
Total office energy consumption in kWh 11,059,868 10,339,123<br />
Total office energy consumption in CO2 equivalent 4,347 4,063<br />
Calculated using World Resource Insititute Greenhouse Gas Protocol: www.ghgprotocol.org/calculation-tools<br />
5.2.4 Human Resources (H.R.)<br />
Permanent Employees Headcount by Operating Unit and Gender<br />
Female Male Total Ratio of<br />
females<br />
<strong>SBM</strong>- GustoMSC 13 97 110 12%<br />
<strong>SBM</strong>- Schiedam 82 314 396 21%<br />
<strong>SBM</strong>- Atlantia 133 348 481 28%<br />
<strong>SBM</strong>- Malaysia 133 300 433 31%<br />
<strong>SBM</strong>- Monaco 391 1,137 1,528 26%<br />
<strong>SBM</strong>- Services 47 169 216 22%<br />
<strong>SBM</strong>- PC 141 1,249 1,390 10%<br />
<strong>SBM</strong> <strong>Offshore</strong>- Group functions 59 72 131 45%<br />
Onshore 90% 69% 73% 26%<br />
<strong>Offshore</strong> 10% 31% 27% 8%<br />
Total 969 3,686 4,655 21%<br />
This is a customized selection from the <strong>SBM</strong> <strong>Offshore</strong> N.V. <strong>Annual</strong> <strong>Report</strong> <strong>2011</strong><br />
88


