2012 Proceedings - International Tissue Elasticity Conference
2012 Proceedings - International Tissue Elasticity Conference
2012 Proceedings - International Tissue Elasticity Conference

Create successful ePaper yourself
Turn your PDF publications into a flip-book with our unique Google optimized e-Paper software.
036 3D RECONSTRUCTION OF IN VIVO ARFI AND SWEI IMAGES OF THE PROSTATE.<br />
Stephen Rosenzweig 1 , Mark L Palmeri 1 , Thomas Polascik 2 , Kathryn R Nightingale 1 .<br />
1 Duke University Biomedical Engineering, USA; 2 Duke University Medical Center, Durham, NC,<br />
28<br />
USA.<br />
Background: Acoustic radiation force impulse (ARFI) imaging and shear wave elasticity imaging (SWEI) of<br />
the prostate have been reported to portray cancer and other pathologies as stiffer than the surrounding<br />
tissue [1,2]. While these methods employ similar push excitations, they differ in resolution, contrast and<br />
artifacts; SWEI images provide quantitative information, but generally afford poorer resolution and can<br />
suffer from reflected wave artifacts [3], whereas ARFI images are typically higher resolution, but do not<br />
reflect the true mechanical contrast of the tissue [4].<br />
Aims: The aim of this work is to reconstruct matched ARFI and SWEI images, which are overlaid and<br />
compared in order to overcome the challenges of each modality and provide additional information.<br />
Methods: ARFI and SWEI data were collected concurrently, in vivo, under an IRB–approved protocol,<br />
using a side–fire Acuson ER7B transducer, a Siemens Acuson SC2000 (Mountain View, CA) and a custom<br />
transducer rotation stage. The data were then reconstructed in 3D taking advantage of spatial<br />
continuity axially, laterally and in elevation as well as left and right propagating shear waves from each<br />
push. The custom pulse sequence consisted of rapidly pushing at multiple foci and tracking the resulting<br />
displacement on– and off–axis of the push using 16 parallel receive beams for each push location.<br />
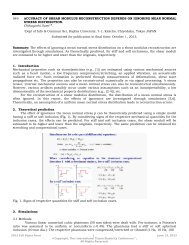
Results: To date, data from 7 patients with known prostate cancer have been obtained prior to radical<br />
prostatectomy surgery in this ongoing study. Example matched ARFI and SWEI images are shown below<br />
where a stiff region has been identified in the basal region of the patient’s right side (white circle) as<br />
compared to the contralateral region (black circle). The ARFI image contrast is 0.64 and the SWEI image<br />
contrast is 0.75; however, the edge resolution is much clearer in the ARFI image as seen at the location of<br />
the arrows in the images, indicating the margin of the central gland. Structural information in these<br />
modalities is significantly improved over B–mode ultrasound.<br />
Conclusions: We have demonstrated the ability to concurrently acquire ARFI and SWEI data and<br />
reconstruct the images utilizing the inherent three dimensional nature of the organ. The high contrast<br />
SWEI images allow the user to more readily identify suspicious regions which can then be localized using<br />
the ARFI image.<br />
Acknowledgements: This work has been supported by NIH grants EB001040 and CA142824. We thank the<br />
Ultrasound Division at Siemens Medical Solutions, USA, Inc. for their technical and in–kind support.<br />
References:<br />
[1] Zhai, L., et al.: Acoustic Radiation Force Impulse Imaging of Human Prostates: Initial In Vivo Demonstration.<br />
Ultrasound Med Biol, 38(1), pp. 50–61, <strong>2012</strong>.<br />
[2] Barr, R.G., et al.: Shear Wave Ultrasound Elastography of the Prostate: Initial Results. Ultrasound Quarterly,<br />
28(1), pp. 13–20, 10.1097, <strong>2012</strong>.<br />
[3] Deffieux, T., et al.: On the Effects of Reflected Waves in Transient Shear Wave Elastography. IEEE UFFC, 58(10),<br />
pp. 2032–35, 2011.<br />
[4] Nightingale, K., et al.: Analysis of Contrast in Images Generated with Transient Acoustic Radiation Force.<br />
Ultrasound Med Biol, 32(1), pp. 61–72, 2006.<br />
Figure 1: Matched coronal B–mode, ARFI, and SWEI images with the regions for contrast and resolution<br />
computations indicated by the circles and arrows, respectively, on the ARFI and SWEI images.<br />
indicates Presenter