2012 Proceedings - International Tissue Elasticity Conference
2012 Proceedings - International Tissue Elasticity Conference
2012 Proceedings - International Tissue Elasticity Conference

Create successful ePaper yourself
Turn your PDF publications into a flip-book with our unique Google optimized e-Paper software.
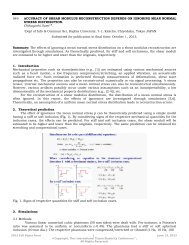
050 SHEAR WAVE DISPERSION MEASURES FAT CONCENTRATION IN A MOUSE LIVER MODEL.<br />
Zaegyoo Hah 1 , Alexander Partin 1 , Gil Zimmerman 1 , Christopher T. Barry 2 , Robert A. Mooney 2 ,<br />
Deborah J. Rubens 2 , Kevin J. Parker 1 .<br />
1 Electrical and Computer Engineering Department, University of Rochester, Rochester, NY, USA;<br />
2 University of Rochester Medical Center, Rochester, NY, USA.<br />
Background: Nonalcoholic fatty liver disease (NAFLD) is characterized by accumulation of fat within the<br />
liver. In the most severe cases, NAFLD can progress to nonalcoholic steatohepatitis (NASH) and<br />
subsequently to liver cirrhosis. Since in many cases NAFLD can be asymptomatic, a non–invasive and<br />
painless method for the measurement of fat concentration within the liver would very beneficial.<br />
Aims: We aim to assess our hypothesis, as illustrated in Figure 1a, that higher fat concentration within a<br />
liver will introduce higher shear speed dispersion, while slightly reducing the shear wave speed. This is a<br />
consequence of adding a viscous component to the liver [1]. Our objective in this study is to compare<br />
experimentally measured shear speed dispersion within liver specimens grouped by measured fat<br />
concentrations.<br />
Methods: A total of 70 mouse liver specimens were scanned ex vivo over a four month period. 35 mice fed<br />
with a regular diet (Lean) and 35 fed with high fat diet (Obese). After hepatectomy, each liver specimen<br />
was embedded in a gelatin phantom and scanned with multiple frequencies between 200 and 350Hz<br />
using the CrW (crawling wave) imaging technique [2]. Using an estimation algorithm, a shear speed<br />
dispersion per 100Hz and shear speed at a reference frequency of 250Hz were obtained for each liver<br />
sample. For the hypothesis assessment, the estimated results are presented on a two parameter plot of<br />
dispersion slope (vertical axis) and shear speed at reference frequency (horizontal axis). The livers were<br />
categorized into two groups, Group 1 containing less than 50% fat and Group 2 with 50% fat or greater.<br />
The data were analyzed using two approaches. In the sample–by–sample approach, each liver specimen’s<br />
estimate is placed in the plot, Figure 1b, where box plot size indicates the standard deviation within each<br />
group. In the group approach, Figure 1c, a linear regression with 95% confidence intervals was used to<br />
obtain the values for dispersion and shear speed of each of two groups. These values, together with the<br />
upper and lower bounds obtained with linear regression, are presented as box plots.<br />
Results: In the sample–by–sample analysis, the dispersion per 100Hz in m/s/Hz and the shear speed in<br />
m/s for the two groups are: (0.13, 2.5) for Group 1 and (0.55, 1.9) for Group 2. The group analysis shows<br />
the following results: (0.12, 2.51) for Group 1 and (0.64, 1.93) for Group 2. Paired t–tests provided the<br />
following p–values: p