2012 Proceedings - International Tissue Elasticity Conference
2012 Proceedings - International Tissue Elasticity Conference
2012 Proceedings - International Tissue Elasticity Conference

Create successful ePaper yourself
Turn your PDF publications into a flip-book with our unique Google optimized e-Paper software.
059 EFFECTS OF THE WALL INCLUSION SIZE AND MODULUS CONTRAST ON THE REGIONAL<br />
PULSE WAVE PROPAGATION ALONG THE ARTERIAL WALL IN SILICO.<br />
Danial Shahmirzadi 1 and Elisa E. Konofagou 1 – Presented by RX Li 1 .<br />
1 Columbia University, VC 12–232, 622 West 168th Street, New York, NY, 10032, USA.<br />
Background: Arterial stiffness has previously been reported as an independent indicator of cardiovascular<br />
diseases such as aortic aneurysm. Existing stiffness measurements methods in vivo are either invasive (e.g.,<br />
catheterization) or provide only an average global estimate (e.g., tonometry). Previous studies of pulse wave<br />
propagation along inhomogeneous arterial walls have shown that a global PWV estimate might not<br />
effectively detect the presence of local stiffness changes [1]. Pulse wave imaging (PWI) is a noninvasive and<br />
local estimation method [2–4] for regional pulse wave velocity (PWV) measurement and visualization.<br />
Aims: Examining the effects of inclusion size and modulus contrast on the regional pulse wave<br />
propagation and velocity along the simulated arterial wall.<br />
Methods: A 3D fluid structure interaction (FSI) simulation of pulse wave propagation was performed in<br />
Coupled Eulerian–Lagrangian (CEL) explicit solver of Abaqus 6.10–1 (Simulia, RI, USA). The Lagrangian<br />
domain, mimicking the canine aorta, composed of a straight geometry tube (L=250mm; ri=12 mm, t=2.2mm)<br />
with a linearly elastic wall (Ewall=5.12MPa, ρwall=1050kg/m3 and Poisson's ratio ν=0.48). The Eulerian domain<br />
encompassed the Lagrangian tube, simulating the presence of a Newtonian fluid medium (ρfluid=1000kg/m3 ,<br />
speed of sound C0=1483m/s and viscosity η=0.0001Pa.s). The FSI was defined as a frictionless two–way<br />
coupling between the tube and the fluid medium. The tube inlet and outlet were fully constrained in x–y–z<br />
directions, and a rectangular initial velocity (V0=5m/s) was applied on the inlet as the driving force for the<br />
dynamic wall motion. The first simulation was performed on the homogenous wall (no inclusion) as the<br />
reference model. The effects of the inclusion size were examined based on a set of simulations of the wall<br />
containing a 2 and 10mm long inclusion with a Young's modulus of 1.50 times the Ewall=5.12MPa. To examine<br />
the effects of the inclusion modulus contrast, a set of simulations were performed on the wall containing a<br />
2mm long inclusion with a Young's modulus of 1.50 and 2.00 times the Ewall=5.12MPa. The wall radial<br />
displacement along the entire tube length (longitudinal spatial resolution of 5mm) was measured at multiple<br />
time–points (temporal resolution of 0.375ms), and the information was mapped onto a 2D spatio–temporal<br />
plane which allowed the visualization of the entire wave propagation.<br />
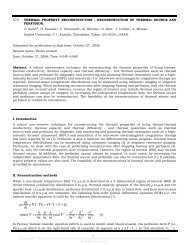
Figure 1: Spatio–temporal plot: (A) Homogenous wall: Ewall=5.12MPa; (B) Inclusion wall: Einc=1.5×Ewall, Linc=2mm;<br />
(C) Inclusion wall: Einc=1.5×Ewall, Linc=10mm; (D) Inclusion wall: Einc=2.0×Ewall, Linc=2mm.<br />
Results: Figure 1 provides the spatio–temporal plots of the wall displacement for the homogenous wall<br />
(Figure 1A), and the inhomogeneous walls (Figures 1B–1D). It is seen that a small portion of the main<br />
forward wave gets reflected at the site of the inclusion while the rest continues to travel forward beyond<br />
the inclusion site under a PWV which remains almost unaffected (not shown)[1]. Quantitative and<br />
qualitative reflection patterns depend on the inclusion properties, e.g. increase in both the inclusion size<br />
(Figures 1B–1C) and modulus contrast (Figures 1B–1D) was found to increase the reflection wave<br />
magnitude. Also, the low wall displacement at the inclusion site forms a standing wave whose width is<br />
correlated to the inclusion size (Figures 1B–1C).<br />
Conclusions: This study of pulse wave propagation along the inhomogeneous arterial walls in silico<br />
highlighted the need for regional PWV measurements, such as those obtained by PWI, in order to detect<br />
the changes in regional wall stiffness. In particular, it was found that spatio–temporal plots of the wall<br />
displacement contain qualitative and quantitative information that can collectively be used to obtain the<br />
size and modulus contrast of the zone entailing the regional changes. Future studies will focus on<br />
examining the pathological conditions, such as the inhomogeneity in modulus and geometry seen in<br />
aortic aneurysm, in order to determine the implications in PWI in vivo.<br />
References:<br />
[1] Shahmirzadi et al.: Artery Res, in press, <strong>2012</strong>.<br />
[2] Fujikura et al.: Ult Imag, 29(3), pp. 137–54, 2007.<br />
[3] Luo et al.: IEEE Ultras Symp, pp. 859–62, 2008.<br />
[4] Vappou et al.: Am J Hyp, 23(4), pp. 393–398, 2010.<br />
64<br />
Axial Location (mm)<br />
0<br />
50<br />
100<br />
150<br />
200<br />
(A)<br />
Forward<br />
0<br />
50<br />
Inclusion site<br />
100<br />
150<br />
200<br />
(B)<br />
Forward<br />
Reflected<br />
Standing<br />
250<br />
250<br />
250<br />
250<br />
0 2 4 6 8 10 0 2 4 6 8 10 0 2 4 6 8 10 0 2 4 6 8 10<br />
Time (ms)<br />
Time (ms)<br />
Time (ms)<br />
Time (ms)<br />
0<br />
50<br />
Inclusion site<br />
100<br />
150<br />
200<br />
(C)<br />
Forward<br />
0<br />
Reflection<br />
50<br />
Standing<br />
Inclusion site<br />
100<br />
150<br />
200<br />
(D)<br />
Forward<br />
Reflection<br />
Standing<br />
indicates Presenter