2012 Proceedings - International Tissue Elasticity Conference
2012 Proceedings - International Tissue Elasticity Conference
2012 Proceedings - International Tissue Elasticity Conference

You also want an ePaper? Increase the reach of your titles
YUMPU automatically turns print PDFs into web optimized ePapers that Google loves.
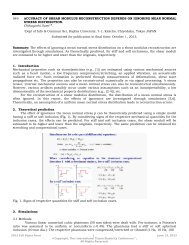
048 COMPRESSION SENSITIVE MAGNETIC RESONANCE ELASTOGRAPHY.<br />
Sebastian Hirsch 1 , Frauke Beyer 1 , Jing Guo 1 , Sebastian Papazoglou 1 , Heiko Tzschätzsch 1 , Andreas<br />
Fehlner 1 , Ingolf Sack 1 , Jürgen Braun 2 .<br />
1 Radiology Department, 2 Institute of Medical Informatics, Charité – University Medicine Berlin,<br />
Berlin, GERMANY.<br />
Background: <strong>Tissue</strong> pressure is an important parameter for the diagnosis of various diseases from<br />
hepatic hypertension, lung fibrosis to hydrocephalus. The intrinsic pressure of a material is related to its<br />
effective compression modulus that scales volumetric strain to pressure [1]. According to the theory of<br />
poroelasticity, volumetric strain in biological tissue may arise from the in– and outflow of compartmental<br />
fluids like blood or CSF [2,3]. In order to measure compressibility, one needs to analyze local volumetric<br />
strain given by the divergence of motion fields.<br />
Aims: The purpose of this study is to test the sensitivity of the divergence of harmonic motion fields<br />
measured by 3D MRE to tissue pressure. <strong>Tissue</strong> pressure is imposed by air pressure applied to agarose<br />
phantoms made compressible through inclusion of air bubbles. Three experiments are demonstrated:<br />
1) Rheometer experiments to measure compressibility by static compression; 2) MRE to measure the<br />
divergence of the harmonic wave field at different values of excess air pressure and 3) MRE under normal<br />
air pressure with increasing motion amplitude for imposing an increasing oscillating pressure.<br />
Methods: Phantoms were built from 1.5% and 0.5% agarose solved in hot water. Gas bubbles were<br />
created by adding different amounts of NaHCO3 and citric acid into the hot agarose–water solution,<br />
yielding phantoms of variable density and reduced compression modulus as tested by a torsional<br />
rheometry device (MCR 301, Anton Paar, Austria) equipped with a circular contact plate (Ø 5cm) and<br />
operated in axial motion mode. For MRE, the phantoms were encased in a pressure chamber which was<br />
placed in a head cradle [1] inside a 1.5T MR scanner (Siemens Sonata, Erlangen, Germany). 3D vector<br />
field MRE was performed as described elsewhere [4]. The divergence of complex wave fields at vibration<br />
frequency (50Hz) was calculated based on multi–dimensional derivative operators [5].<br />
Results: Rheometer experiments illustrate that the compression modulus of agarose phantoms decreases<br />
with the bulk density, indicating that gas bubbles contribute to the compressibility of the effective medium<br />
(Figure 1A). The normalized displacement field divergence increases with external air pressure (Figure 1B),<br />
the slope of that relation being correlated with the density of the effective medium (Figure 1C). The<br />
expectation value of the magnitude of the oscillating displacement field divergence is linearly dependent on<br />
the measured mean displacement field, as can be expected from theory (Figure 1D). The slope of this<br />
relation is proportional to the inverse of the compression modulus, 1/K. The comparison of the lines for a<br />
phantom with gas bubbles and a solid one yields a ratio of compression moduli of 3 (solid/bubble).<br />
Conclusions: By measuring volumetric strain MRE is sensitive to the inherent pressure and the<br />
compressibility of tissue. The introduced phantoms represent a valid model for compressible materials such as<br />
lung tissue [1]. However, further work is necessary for modeling the permeation of biological tissue by fluid–filled<br />
vessels which may result in a more complex pressure–strain relationship than the model introduced herein.<br />
References:<br />
[1] Hirsch et al.: Magn Reson Med, doi:10.1002/mrm.24294, <strong>2012</strong>.<br />
[2] Leiderman et al.: Phys Med Biol, 51, pp. 6291–313, 2006.<br />
[3] Perrinez et al.: IEEE Trans Biomed Eng, 56, pp. 598–608, 2009.<br />
[4] Romano et al.: Magn Reson Med, doi: 10.1002/mrm.24141, <strong>2012</strong>.<br />
[5] Anderssen and Hegland Math Comput, 68, pp. 1121–1141, 1999.<br />
50<br />
40<br />
30<br />
Phantom 3<br />
Phantom 2<br />
Phantom 1<br />
20<br />
10<br />
0.2 0.4 0.6 0.8<br />
Excess pressure in bar<br />
1<br />
mean displacement amplitude in 10<br />
Figure 1: A) Compression moduli of agarose phantom with different gas bubble concentrations obtained from rheometer<br />
experiments. B) Dependence of the normalized displacement field divergence on external air pressure for 3 phantoms with<br />
different gas bubble concentrations (1: lowest concentration, 3: highest concentration). C) Slopes of the fits from B) as a<br />
function of bulk density. The density index is a relative measure of the bubble concentration derived from MRE<br />
magnitude images. D) Relation between measured values of |div(u)| and the stimulated displacement amplitude.<br />
-5 1.2<br />
0.8<br />
20<br />
16<br />
12<br />
12<br />
8<br />
Phantom with bubbles<br />
Solid phantom<br />
0.4<br />
8<br />
4<br />
0<br />
4<br />
0<br />
0.7 0.8 0.9<br />
ρ in g/cm<br />
0.8 1.2 1.6 2 0 0.5 1 1.5 2 2.5 3 3.5<br />
m<br />
3<br />
A) B) C) D)<br />
50<br />
40<br />
30<br />
Phantom 3<br />
Phantom 2<br />
Phantom 1<br />
20<br />
10<br />
0.2 0.4 0.6 0.8<br />
Excess pressure in bar<br />
1<br />
Density index [a.u.] mean displacement amplitude in 10-5 1.2<br />
0.8<br />
20<br />
16<br />
12<br />
12<br />
8<br />
Phantom with bubbles<br />
Solid phantom<br />
0.4<br />
8<br />
4<br />
0<br />
4<br />
0<br />
0.7 0.8 0.9<br />
ρ in g/cm<br />
0.8 1.2 1.6 2 0 0.5 1 1.5 2 2.5 3 3.5<br />
m<br />
3<br />
A) B) C) D)<br />
Density index [a.u.]<br />
54<br />
K in 106 K in 10 Pa 6 Pa<br />
mean(|div(u)|)/mean(|u|) mean(|div(u)|)/mean(|u|) in 1/m<br />
Slope from B) in 1/(bar∙m)<br />
|div(u)| in 10-4 |div(u)| in 10-4 indicates Presenter