You also want an ePaper? Increase the reach of your titles
YUMPU automatically turns print PDFs into web optimized ePapers that Google loves.
16<br />
EUROPEAN E-COMMERCE, GOODS AND SERVICES EUROPE <strong>B2C</strong> E-COMMERCE<br />
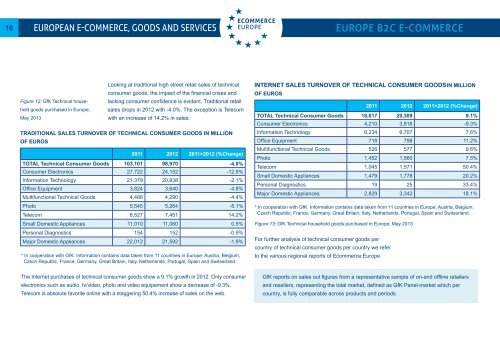
Figure 12: GfK Technical house-<br />
hold goods purchased in <strong>Europe</strong>,<br />
May <strong>2013</strong><br />
Looking at traditional high street retail sales of technical<br />
consumer goods, the impact of the financial crises and<br />
lacking consumer confidence is evident. Traditional retail<br />
sales drops in 2012 with -4.0%. The exception is Telecom<br />
with an increase of 14.2% in sales.<br />
TRADITIONAL SALES TURNOVER OF TECHNICAL CONSUMER GOODS IN MILLION<br />
OF EUROS<br />
2011 2012 2011>2012 (%Change)<br />
TOTAL Technical Consumer Goods 103,101 98,970 -4.0%<br />
Consumer Electronics 27,722 24,152 -12.9%<br />
Information Technology 21,379 20,938 -2.1%<br />
Office Equipment 3,824 3,640 -4.8%<br />
Multifunctional Technical Goods 4,486 4,290 -4.4%<br />
Photo 5,545 5,264 -5.1%<br />
Telecom 6,527 7,451 14.2%<br />
Small Domestic Appliances 11,010 11,060 0.5%<br />
Personal Diagnostics 154 152 -0.9%<br />
Major Domestic Appliances 22,012 21,592 -1.9%<br />
* In cooperation with GfK. Information contains data taken from 11 countries in <strong>Europe</strong>: Austria, Belgium,<br />
Czech Republic, France, Germany, Great Britain, Italy, Netherlands, Portugal, Spain and Switserland.<br />
The Internet purchases of technical consumer goods show a 9.1% growth in 2012. Only consumer<br />
electronics such as audio, tv/video, photo and video equipement show a decrease of -9.3%.<br />
Telecom is absolute favorite online with a staggering 50.4% increase of sales on the web.<br />
INTERNET SALES TURNOVER OF TECHNICAL CONSUMER GOODS IN MILLION<br />
OF EUROS<br />
For further analysis of technical consumer goods per<br />
country of technical consumer goods per country we refer<br />
to the various regional reports of <strong>Ecommerce</strong> <strong>Europe</strong><br />
2011 2012 2011>2012 (%Change)<br />
TOTAL Technical Consumer Goods 18,617 20,309 9.1%<br />
Consumer Electronics 4,210 3,818 -9.3%<br />
Information Technology 6,234 6,707 7.6%<br />
Office Equipment 718 798 11.2%<br />
Multifunctional Technical Goods 526 577 9.6%<br />
Photo 1,452 1,560 7.5%<br />
Telecom 1,045 1,571 50.4%<br />
Small Domestic Appliances 1,479 1,778 20.2%<br />
Personal Diagnostics 19 25 33.4%<br />
Major Domestic Appliances 2,829 3,342 18.1%<br />
* In cooperation with GfK. Information contains data taken from 11 countries in <strong>Europe</strong>: Austria, Belgium,<br />
Czech Republic, France, Germany, Great Britain, Italy, Netherlands, Portugal, Spain and Switserland.<br />
Figure 13: GfK Technical household goods purchased in <strong>Europe</strong>, May <strong>2013</strong><br />
GfK reports on sales out figures from a representative sample of on-and offline retailers<br />
and resellers, representing the total market, defined as GfK Panel-market which per<br />
country, is fully comparable across products and periods.


