Final report - Integrated Land Management Bureau
Final report - Integrated Land Management Bureau
Final report - Integrated Land Management Bureau

You also want an ePaper? Increase the reach of your titles
YUMPU automatically turns print PDFs into web optimized ePapers that Google loves.
Transportation Assessment of the Central & North Coast of BC<br />
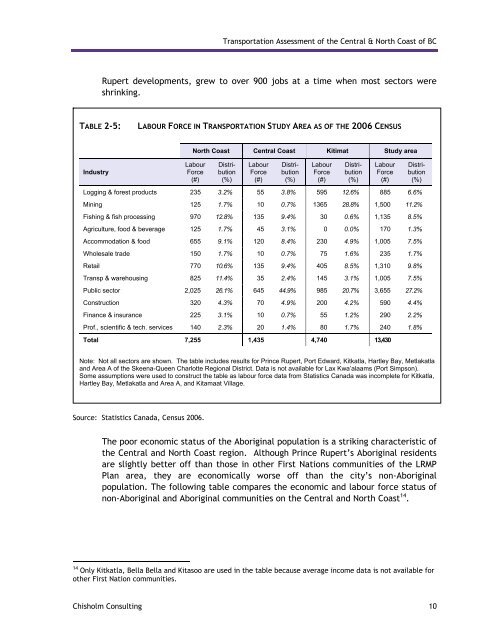
Rupert developments, grew to over 900 jobs at a time when most sectors were<br />
shrinking.<br />
TABLE 2-5: LABOUR FORCE IN TRANSPORTATION STUDY AREA AS OF THE 2006 CENSUS<br />
Industry<br />
Source: Statistics Canada, Census 2006.<br />
North Coast Central Coast Kitimat Study area<br />
Labour<br />
Force<br />
(#)<br />
Distri-<br />
bution<br />
(%)<br />
Labour<br />
Force<br />
(#)<br />
Distribution<br />
(%)<br />
Labour<br />
Force<br />
(#)<br />
Distri-<br />
bution<br />
(%)<br />
Labour<br />
Force<br />
(#)<br />
Logging & forest products 235 3.2% 55 3.8% 595 12.6% 885 6.6%<br />
Mining 125 1.7% 10 0.7% 1365 28.8% 1,500 11.2%<br />
Fishing & fish processing 970 12.8% 135 9.4% 30 0.6% 1,135 8.5%<br />
Agriculture, food & beverage 125 1.7% 45 3.1% 0 0.0% 170 1.3%<br />
Accommodation & food 655 9.1% 120 8.4% 230 4.9% 1,005 7.5%<br />
Wholesale trade 150 1.7% 10 0.7% 75 1.6% 235 1.7%<br />
Retail 770 10.6% 135 9.4% 405 8.5% 1,310 9.8%<br />
Transp & warehousing 825 11.4% 35 2.4% 145 3.1% 1,005 7.5%<br />
Public sector 2,025 26.1% 645 44.9% 985 20.7% 3,655 27.2%<br />
Construction 320 4.3% 70 4.9% 200 4.2% 590 4.4%<br />
Finance & insurance 225 3.1% 10 0.7% 55 1.2% 290 2.2%<br />
Prof., scientific & tech. services 140 2.3% 20 1.4% 80 1.7% 240 1.8%<br />
Total 7,255 1,435 4,740 13,430<br />
Distri-<br />
bution<br />
(%)<br />
Note: Not all sectors are shown. The table includes results for Prince Rupert, Port Edward, Kitkatla, Hartley Bay, Metlakatla<br />
and Area A of the Skeena-Queen Charlotte Regional District. Data is not available for Lax Kwa’alaams (Port Simpson).<br />
Some assumptions were used to construct the table as labour force data from Statistics Canada was incomplete for Kitkatla,<br />
Hartley Bay, Metlakatla and Area A, and Kitamaat Village.<br />
The poor economic status of the Aboriginal population is a striking characteristic of<br />
the Central and North Coast region. Although Prince Rupert’s Aboriginal residents<br />
are slightly better off than those in other First Nations communities of the LRMP<br />
Plan area, they are economically worse off than the city’s non-Aboriginal<br />
population. The following table compares the economic and labour force status of<br />
non-Aboriginal and Aboriginal communities on the Central and North Coast 14 .<br />
14<br />
Only Kitkatla, Bella Bella and Kitasoo are used in the table because average income data is not available for<br />
other First Nation communities.<br />
Chisholm Consulting 10