The relevance of energy storages for an autarky of electricity supply ...
The relevance of energy storages for an autarky of electricity supply ...
The relevance of energy storages for an autarky of electricity supply ...

Create successful ePaper yourself
Turn your PDF publications into a flip-book with our unique Google optimized e-Paper software.
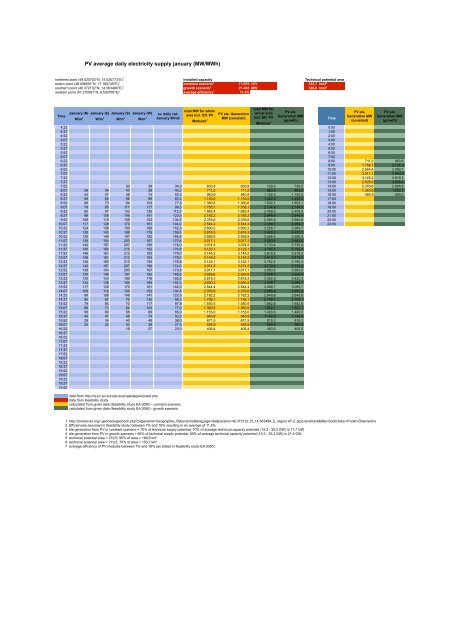
PV average daily <strong>electricity</strong> <strong>supply</strong> j<strong>an</strong>uary (MW/MWh)<br />
northerst point (49.020703°N, 15.020773°E) 1<br />
estern point (48.006691°N, 17.160749°E) 1<br />
southern point (46.372132°N, 14.563494°E) 1<br />
western point (47.270581°N, 9.530768°E) 1<br />
Time<br />
J<strong>an</strong>uary (N) J<strong>an</strong>uary (E) J<strong>an</strong>uary (S) J<strong>an</strong>uary (W)<br />
W/m 2<br />
W/m 2<br />
W/m 2<br />
W/m 2<br />
av. daily rad.<br />
J<strong>an</strong>uary W/m2<br />
Installed capacity Technical potential area<br />
const<strong>an</strong>t szenario 3<br />
17.675 MW 153,7 km2 6<br />
growth szenario 4<br />
21.463 MW 186,6 km2 5<br />
average efficiency 7<br />
11,5%<br />
4:22 0:00<br />
4:37 1:00<br />
4:52 2:00<br />
5:07 3:00<br />
5:22 4:00<br />
5:37 5:00<br />
5:52 6:00<br />
6:07 7:00<br />
6:22 8:00 711,2 863,6<br />
6:37 9:00 1.758,1 2.134,9<br />
6:52 10:00 2.544,4 3.089,7<br />
7:07 11:00 3.017,1 3.663,6<br />
7:22 12:00 3.145,2 3.819,2<br />
7:37 13:00 2.928,8 3.556,4<br />
7:52 30 38 34,0 600,8 600,8 729,5 729,5 14:00 2.376,6 2.885,8<br />
8:07 29 34 40 58 40,3 711,2 711,2 863,6 863,6 15:00 1.360,6 1.652,1<br />
8:22 44 47 48 74 53,3 940,9 940,9 1.142,5 1.142,5 16:00 485,9 590,0<br />
8:37 56 60 56 89 65,3 1.153,0 1.153,0 1.400,0 1.400,0 17:00<br />
8:52 68 73 64 103 77,0 1.360,6 1.360,6 1.652,1 1.652,1 18:00<br />
9:07 79 85 117 117 99,5 1.758,1 1.758,1 2.134,9 2.134,9 19:00<br />
9:22 90 97 132 130 112,3 1.983,4 1.983,4 2.408,5 2.408,5 20:00<br />
9:37 99 108 146 141 123,5 2.182,2 2.182,2 2.649,8 2.649,8 21:00<br />
9:52 108 119 159 152 134,5 2.376,6 2.376,6 2.885,8 2.885,8 22:00<br />
10:07 117 128 170 161 144,0 2.544,4 2.544,4 3.089,7 3.089,7 23:00<br />
10:22 124 136 180 169 152,3 2.690,2 2.690,2 3.266,7 3.266,7<br />
10:37 130 143 189 176 159,5 2.818,3 2.818,3 3.422,3 3.422,3<br />
10:52 135 149 197 182 165,8 2.928,8 2.928,8 3.556,4 3.556,4<br />
11:07 139 154 203 187 170,8 3.017,1 3.017,1 3.663,6 3.663,6<br />
11:22 142 157 207 190 174,0 3.074,5 3.074,5 3.733,4 3.733,4<br />
11:37 145 160 210 192 176,8 3.123,1 3.123,1 3.792,4 3.792,4<br />
11:52 146 161 212 193 178,0 3.145,2 3.145,2 3.819,2 3.819,2<br />
12:07 146 161 212 193 178,0 3.145,2 3.145,2 3.819,2 3.819,2<br />
12:22 145 160 210 192 176,8 3.123,1 3.123,1 3.792,4 3.792,4<br />
12:37 142 157 207 190 174,0 3.074,5 3.074,5 3.733,4 3.733,4<br />
12:52 139 154 203 187 170,8 3.017,1 3.017,1 3.663,6 3.663,6<br />
13:07 135 149 197 182 165,8 2.928,8 2.928,8 3.556,4 3.556,4<br />
13:22 130 143 189 176 159,5 2.818,3 2.818,3 3.422,3 3.422,3<br />
13:37 124 136 180 169 152,3 2.690,2 2.690,2 3.266,7 3.266,7<br />
13:52 117 128 170 161 144,0 2.544,4 2.544,4 3.089,7 3.089,7<br />
14:07 108 119 159 152 134,5 2.376,6 2.376,6 2.885,8 2.885,8<br />
14:22 99 108 146 141 123,5 2.182,2 2.182,2 2.649,8 2.649,8<br />
14:37 90 97 76 130 98,3 1.736,1 1.736,1 2.108,1 2.108,1<br />
14:52 79 85 70 117 87,8 1.550,5 1.550,5 1.882,8 1.882,8<br />
15:07 68 73 64 103 77,0 1.360,6 1.360,6 1.652,1 1.652,1<br />
15:22 56 60 56 89 65,3 1.153,0 1.153,0 1.400,0 1.400,0<br />
15:37 44 47 48 74 53,3 940,9 940,9 1.142,5 1.142,5<br />
15:52 29 34 40 49 38,0 671,5 671,5 815,3 815,3<br />
16:07 20 22 30 38 27,5 485,9 485,9 590,0 590,0<br />
16:22 19 27 23,0 406,4 406,4 493,5 493,5<br />
16:37<br />
16:52<br />
17:07<br />
17:22<br />
17:37<br />
17:52<br />
18:07<br />
18:22<br />
18:37<br />
18:52<br />
19:07<br />
19:22<br />
19:37<br />
19:52<br />
data from http://re.jrc.ec.europa.eu/pvgis/apps4/pvest.php<br />
data from feasibility study<br />
calculated from given data (feasibility study EA 2050) - const<strong>an</strong>t szenario<br />
calculated from given data (feasibility study EA 2050) - growth szenario<br />
total MW <strong>for</strong> whole<br />
area incl. Eff. PV<br />
Modules 2<br />
PV ele. Generation<br />
MW (const<strong>an</strong>t)<br />
total MW <strong>for</strong><br />
whole area<br />
incl. Eff. PV<br />
PV ele.<br />
Generation MW<br />
(growth)<br />
1 http://toolserver.org/~geohack/geohack.php?pagename=Geographie_Österreichs&l<strong>an</strong>guage=de¶ms=46.372132_N_14.563494_E_region:AT-2_type:l<strong>an</strong>dmark&title=Südlichster+Punkt+Österreichs<br />
2 Efficiencies assumed in feasibility study: between 7% <strong>an</strong>d 16% resulting in <strong>an</strong> average <strong>of</strong> 11,5%<br />
3 ele generation from PV in const<strong>an</strong>t szenario = 70% <strong>of</strong> technical <strong>supply</strong> potential; 70% <strong>of</strong> average technical capacity potential (15,3 - 35,2 GW) is 17,7 GW<br />
4 ele generation from PV in growth szenario = 85% <strong>of</strong> technical <strong>supply</strong> potential; 85% <strong>of</strong> average technical capacity potential (15,3 - 35,2 GW) is 21,5 GW<br />
5 technical potential area = 219,5; 85% <strong>of</strong> area = 186,6 km 2<br />
6 technical potential area = 219,5; 70% <strong>of</strong> area = 153,7 km 2<br />
7 average efficiency <strong>of</strong> PV modules between 7% <strong>an</strong>d 16% (as stated in feasibility study EA 2050)<br />
Modules 2<br />
Time<br />
PV ele.<br />
Generation MW<br />
(const<strong>an</strong>t)<br />
PV ele.<br />
Generation MW<br />
(growth)