The relevance of energy storages for an autarky of electricity supply ...
The relevance of energy storages for an autarky of electricity supply ...
The relevance of energy storages for an autarky of electricity supply ...

Create successful ePaper yourself
Turn your PDF publications into a flip-book with our unique Google optimized e-Paper software.
Hour<br />
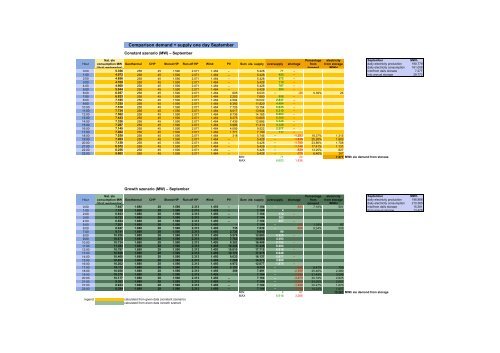
Comparison dem<strong>an</strong>d + <strong>supply</strong> one day September<br />
September MWh<br />
daily <strong>electricity</strong> production 190.779<br />
daily <strong>electricity</strong> consumption 161.008<br />
0:00 5.356 258 45 1.590 2.071 1.464 – 5.428 71 – into/from daily storage 7.277<br />
1:00 4.973 258 45 1.590 2.071 1.464 – 5.428 455 – into <strong>an</strong>nual storage 29.772<br />
2:00 4.856 258 45 1.590 2.071 1.464 – 5.428 572 –<br />
3:00 4.709 258 45 1.590 2.071 1.464 – 5.428 719 –<br />
4:00 4.660 258 45 1.590 2.071 1.464 – 5.428 767 –<br />
5:00 5.044 258 45 1.590 2.071 1.464 – 5.428 384 –<br />
6:00 6.057 258 45 1.590 2.071 1.464 605 6.033 – -24 0,39% 26<br />
7:00 6.823 258 45 1.590 2.071 1.464 2.253 7.680 858 –<br />
8:00 7.185 258 45 1.590 2.071 1.464 4.594 10.022 2.837 –<br />
9:00 7.335 258 45 1.590 2.071 1.464 6.392 11.820 4.484 –<br />
10:00 7.518 258 45 1.590 2.071 1.464 7.726 13.154 5.635 –<br />
11:00 7.734 258 45 1.590 2.071 1.464 8.517 13.944 6.210 –<br />
12:00 7.562 258 45 1.590 2.071 1.464 8.738 14.165 6.603 –<br />
13:00 7.443 258 45 1.590 2.071 1.464 8.375 13.803 6.360 –<br />
14:00 7.326 258 45 1.590 2.071 1.464 7.439 12.866 5.540 –<br />
15:00 7.287 258 45 1.590 2.071 1.464 5.986 11.413 4.126 –<br />
16:00 7.145 258 45 1.590 2.071 1.464 4.095 9.522 2.377 –<br />
17:00 7.082 258 45 1.590 2.071 1.464 1.771 7.199 117 –<br />
18:00 7.039 258 45 1.590 2.071 1.464 318 5.746 – -1.293 18,37% 1.315<br />
19:00 7.263 258 45 1.590 2.071 1.464 – 5.428 – -1.836 25,28% 1.903<br />
20:00 7.128 258 45 1.590 2.071 1.464 – 5.428 – -1.700 23,86% 1.708<br />
21:00 6.572 258 45 1.590 2.071 1.464 – 5.428 – -1.144 17,41% 1.131<br />
22:00 6.256 258 45 1.590 2.071 1.464 – 5.428 – -829 13,25% 827<br />
23:00 5.802 258 45 1.590 2.071 1.464 – 5.428 – -375 6,46% 367<br />
MIN 71 24 7.277 MWh ele dem<strong>an</strong>d from storage<br />
MAX 6.603 1.836<br />
Hour<br />
Nat. ele<br />
consumption MW<br />
(thrid wednesday)<br />
Const<strong>an</strong>t szenario (MW) – September<br />
Geothermal CHP Stored HP<br />
Growth szenario (MW) – September<br />
Nat. ele<br />
consumption MW Geothermal<br />
(thrid wednesday)<br />
CHP Stored HP<br />
Run-<strong>of</strong>f HP Wind<br />
PV Sum ele. <strong>supply</strong><br />
<strong>electricity</strong><br />
from storage<br />
(MWh)<br />
September MWh<br />
daily <strong>electricity</strong> production 196.886<br />
daily <strong>electricity</strong> consumption 210.365<br />
0:00 7.647 1.680 28 1.590 2.313 1.493 – 7.104 – -543 7,10% 501 into/from daily storage 15.281<br />
1:00 7.100 1.680 28 1.590 2.313 1.493 – 7.104 4 – from <strong>an</strong>nual storage 13.478<br />
2:00 6.933 1.680 28 1.590 2.313 1.493 – 7.104 172 –<br />
3:00 6.723 1.680 28 1.590 2.313 1.493 – 7.104 382 –<br />
4:00 6.654 1.680 28 1.590 2.313 1.493 – 7.104 451 –<br />
5:00 7.201 1.680 28 1.590 2.313 1.493 – 7.104 – -97 1,34% 97<br />
6:00 8.647 1.680 28 1.590 2.313 1.493 735 7.839 – -808 9,34% 808<br />
7:00 9.741 1.680 28 1.590 2.313 1.493 2.736 9.840 99 –<br />
8:00 10.258 1.680 28 1.590 2.313 1.493 5.579 12.683 2.425 –<br />
9:00 10.473 1.680 28 1.590 2.313 1.493 7.762 14.866 4.393 –<br />
10:00 10.734 1.680 28 1.590 2.313 1.493 9.382 16.486 5.752 –<br />
11:00 11.043 1.680 28 1.590 2.313 1.493 10.342 17.446 6.404 –<br />
12:00 10.797 1.680 28 1.590 2.313 1.493 10.610 17.715 6.918 –<br />
13:00 10.626 1.680 28 1.590 2.313 1.493 10.170 17.275 6.649 –<br />
14:00 10.460 1.680 28 1.590 2.313 1.493 9.033 16.137 5.677 –<br />
15:00 10.404 1.680 28 1.590 2.313 1.493 7.268 14.373 3.969 –<br />
16:00 10.202 1.680 28 1.590 2.313 1.493 4.972 12.077 1.875 –<br />
17:00 10.112 1.680 28 1.590 2.313 1.493 2.151 9.255 – -856 8,47% 785<br />
18:00 10.050 1.680 28 1.590 2.313 1.493 386 7.491 – -2.559 25,46% 2.380<br />
19:00 10.370 1.680 28 1.590 2.313 1.493 – 7.104 – -3.266 31,49% 3.098<br />
20:00 10.177 1.680 28 1.590 2.313 1.493 – 7.104 – -3.073 30,19% 2.825<br />
21:00 9.383 1.680 28 1.590 2.313 1.493 – 7.104 – -2.279 24,28% 2.061<br />
22:00 8.933 1.680 28 1.590 2.313 1.493 – 7.104 – -1.828 20,47% 1.670<br />
23:00 8.284 1.680 28 1.590 2.313 1.493 – 7.104 – -1.180 14,24% 1.057<br />
MIN 4 97 15.281 MWh ele dem<strong>an</strong>d from storage<br />
MAX 6.918 3.266<br />
legend: calculated from given data (const<strong>an</strong>t szenario)<br />
calculated from given data (growth szenario)<br />
over<strong>supply</strong><br />
shortage<br />
Run-<strong>of</strong>f HP Wind PV Sum ele. <strong>supply</strong> over<strong>supply</strong> shortage<br />
Percentage<br />
from<br />
dem<strong>an</strong>d<br />
Percentage<br />
from<br />
dem<strong>an</strong>d<br />
<strong>electricity</strong><br />
from storage<br />
(MWh)