The relevance of energy storages for an autarky of electricity supply ...
The relevance of energy storages for an autarky of electricity supply ...
The relevance of energy storages for an autarky of electricity supply ...

Create successful ePaper yourself
Turn your PDF publications into a flip-book with our unique Google optimized e-Paper software.
Hour<br />
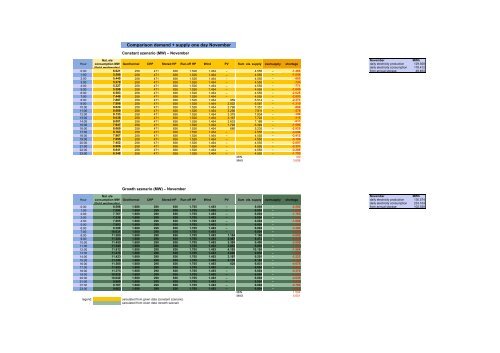
Comparison dem<strong>an</strong>d + <strong>supply</strong> one day November<br />
Sum ele. <strong>supply</strong><br />
November MWh<br />
daily <strong>electricity</strong> production 129.928<br />
daily <strong>electricity</strong> consumption 178.412<br />
0:00 6.021 258 471 836 1.526 1.464 – 4.555 – -1.466 from <strong>an</strong>nual storage 48.484<br />
1:00 5.599 258 471 836 1.526 1.464 – 4.555 – -1.044<br />
2:00 5.440 258 471 836 1.526 1.464 – 4.555 – -885<br />
3:00 5.279 258 471 836 1.526 1.464 – 4.555 – -724<br />
4:00 5.327 258 471 836 1.526 1.464 – 4.555 – -771<br />
5:00 5.598 258 471 836 1.526 1.464 – 4.555 – -1.043<br />
6:00 6.583 258 471 836 1.526 1.464 – 4.555 – -2.028<br />
7:00 7.448 258 471 836 1.526 1.464 – 4.555 – -2.893<br />
8:00 7.887 258 471 836 1.526 1.464 959 5.514 – -2.373<br />
9:00 7.906 258 471 836 1.526 1.464 2.032 6.587 – -1.319<br />
10:00 8.020 258 471 836 1.526 1.464 2.796 7.351 – -668<br />
11:00 8.089 258 471 836 1.526 1.464 3.256 7.811 – -278<br />
12:00 8.133 258 471 836 1.526 1.464 3.379 7.934 – -199<br />
13:00 8.038 258 471 836 1.526 1.464 3.167 7.722 – -315<br />
14:00 8.001 258 471 836 1.526 1.464 2.633 7.188 – -813<br />
15:00 7.947 258 471 836 1.526 1.464 1.793 6.349 – -1.599<br />
16:00 8.060 258 471 836 1.526 1.464 680 5.235 – -2.825<br />
17:00 8.163 258 471 836 1.526 1.464 – 4.555 – -3.608<br />
18:00 7.967 258 471 836 1.526 1.464 – 4.555 – -3.412<br />
19:00 7.655 258 471 836 1.526 1.464 – 4.555 – -3.100<br />
20:00 7.452 258 471 836 1.526 1.464 – 4.555 – -2.897<br />
21:00 6.906 258 471 836 1.526 1.464 – 4.555 – -2.351<br />
22:00 6.841 258 471 836 1.526 1.464 – 4.555 – -2.286<br />
23:00 6.348 258 471 836 1.526 1.464 – 4.555 – -1.793<br />
MIN 199<br />
MAX 3.608<br />
Hour<br />
Nat. ele<br />
consumption MW<br />
(thrid wednesday)<br />
Const<strong>an</strong>t szenario (MW) – November<br />
Geothermal CHP Stored HP Run-<strong>of</strong>f HP Wind PV<br />
Growth szenario (MW) – November<br />
Nat. ele<br />
consumption MW Geothermal<br />
(thrid wednesday)<br />
CHP Stored HP Run-<strong>of</strong>f HP<br />
Wind PV Sum ele. <strong>supply</strong><br />
over<strong>supply</strong> shortage<br />
November MWh<br />
daily <strong>electricity</strong> production 130.574<br />
daily <strong>electricity</strong> consumption 233.104<br />
0:00 8.596 1.680 290 836 1.705 1.493 – 6.004 – -2.592 from <strong>an</strong>nual storage 102.530<br />
1:00 7.994 1.680 290 836 1.705 1.493 – 6.004 – -1.989<br />
2:00 7.767 1.680 290 836 1.705 1.493 – 6.004 – -1.763<br />
3:00 7.538 1.680 290 836 1.705 1.493 – 6.004 – -1.533<br />
4:00 7.605 1.680 290 836 1.705 1.493 – 6.004 – -1.600<br />
5:00 7.993 1.680 290 836 1.705 1.493 – 6.004 – -1.989<br />
6:00 9.398 1.680 290 836 1.705 1.493 – 6.004 – -3.394<br />
7:00 10.634 1.680 290 836 1.705 1.493 – 6.004 – -4.630<br />
8:00 11.260 1.680 290 836 1.705 1.493 1.164 7.168 – -4.092<br />
9:00 11.288 1.680 290 836 1.705 1.493 2.467 8.472 – -2.816<br />
10:00 11.450 1.680 290 836 1.705 1.493 3.395 9.400 – -2.050<br />
11:00 11.549 1.680 290 836 1.705 1.493 3.953 9.958 – -1.591<br />
12:00 11.612 1.680 290 836 1.705 1.493 4.103 10.108 – -1.504<br />
13:00 11.476 1.680 290 836 1.705 1.493 3.846 9.850 – -1.625<br />
14:00 11.423 1.680 290 836 1.705 1.493 3.197 9.201 – -2.222<br />
15:00 11.346 1.680 290 836 1.705 1.493 2.178 8.182 – -3.164<br />
16:00 11.508 1.680 290 836 1.705 1.493 826 6.831 – -4.678<br />
17:00 11.655 1.680 290 836 1.705 1.493 – 6.004 – -5.651<br />
18:00 11.375 1.680 290 836 1.705 1.493 – 6.004 – -5.370<br />
19:00 10.929 1.680 290 836 1.705 1.493 – 6.004 – -4.925<br />
20:00 10.640 1.680 290 836 1.705 1.493 – 6.004 – -4.635<br />
21:00 9.860 1.680 290 836 1.705 1.493 – 6.004 – -3.856<br />
22:00 9.767 1.680 290 836 1.705 1.493 – 6.004 – -3.762<br />
23:00 9.063 1.680 290 836 1.705 1.493 – 6.004 – -3.059<br />
MIN 1.504<br />
MAX 5.651<br />
legend: calculated from given data (const<strong>an</strong>t szenario)<br />
calculated from given data (growth szenario)<br />
over<strong>supply</strong><br />
shortage