The relevance of energy storages for an autarky of electricity supply ...
The relevance of energy storages for an autarky of electricity supply ...
The relevance of energy storages for an autarky of electricity supply ...

Create successful ePaper yourself
Turn your PDF publications into a flip-book with our unique Google optimized e-Paper software.
Hour<br />
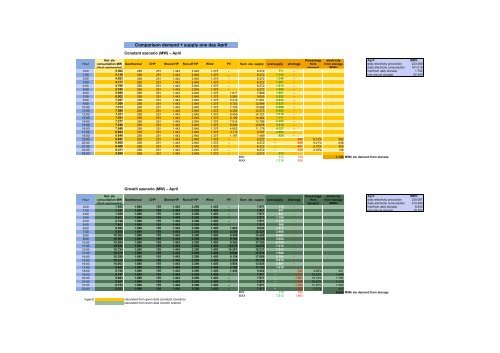
Comparison dem<strong>an</strong>d + <strong>supply</strong> one day April<br />
Const<strong>an</strong>t szenario (MW) – April<br />
April MWh<br />
daily <strong>electricity</strong> production 223.468<br />
daily <strong>electricity</strong> consumption 161.019<br />
0:00 5.502 258 251 1.443 2.945 1.375 – 6.272 771 – into/from daily storage 1.752<br />
1:00 5.130 258 251 1.443 2.945 1.375 – 6.272 1.143 – into <strong>an</strong>nual storage 62.449<br />
2:00 4.923 258 251 1.443 2.945 1.375 – 6.272 1.349 –<br />
3:00 4.771 258 251 1.443 2.945 1.375 – 6.272 1.501 –<br />
4:00 4.760 258 251 1.443 2.945 1.375 – 6.272 1.513 –<br />
5:00 5.185 258 251 1.443 2.945 1.375 – 6.272 1.088 –<br />
6:00 5.998 258 251 1.443 2.945 1.375 1.617 7.889 1.891 –<br />
7:00 6.902 258 251 1.443 2.945 1.375 3.583 9.855 2.952 –<br />
8:00 7.257 258 251 1.443 2.945 1.375 5.319 11.591 4.333 –<br />
9:00 7.360 258 251 1.443 2.945 1.375 6.723 12.996 5.635 –<br />
10:00 7.413 258 251 1.443 2.945 1.375 7.726 13.998 6.586 –<br />
11:00 7.589 258 251 1.443 2.945 1.375 8.300 14.573 6.983 –<br />
12:00 7.511 258 251 1.443 2.945 1.375 8.455 14.727 7.216 –<br />
13:00 7.291 258 251 1.443 2.945 1.375 8.190 14.462 7.171 –<br />
14:00 7.277 258 251 1.443 2.945 1.375 7.514 13.786 6.509 –<br />
15:00 7.168 258 251 1.443 2.945 1.375 6.405 12.678 5.510 –<br />
16:00 7.048 258 251 1.443 2.945 1.375 4.903 11.176 4.127 –<br />
17:00 6.894 258 251 1.443 2.945 1.375 3.114 9.387 2.493 –<br />
18:00 6.840 258 251 1.443 2.945 1.375 1.197 7.469 629 –<br />
19:00 6.827 258 251 1.443 2.945 1.375 – 6.272 – -555 8,12% 562<br />
20:00 6.908 258 251 1.443 2.945 1.375 – 6.272 – -636 9,21% 648<br />
21:00 6.680 258 251 1.443 2.945 1.375 – 6.272 – -407 6,10% 403<br />
22:00 6.411 258 251 1.443 2.945 1.375 – 6.272 – -138 2,16% 138<br />
23:00 5.899 258 251 1.443 2.945 1.375 – 6.272 373 –<br />
MIN 373 138 1.752 MWh ele dem<strong>an</strong>d from storage<br />
MAX 7.216 636<br />
Hour<br />
Nat. ele<br />
consumption MW<br />
(thrid wednesday)<br />
Geothermal CHP Stored HP<br />
Growth szenario (MW) – April<br />
Run-<strong>of</strong>f HP Wind<br />
PV Sum ele. <strong>supply</strong><br />
Nat. ele<br />
consumption MW Geothermal<br />
(thrid wednesday)<br />
CHP Stored HP Run-<strong>of</strong>f HP Wind PV Sum ele. <strong>supply</strong> over<strong>supply</strong> shortage<br />
Percentage<br />
from<br />
dem<strong>an</strong>d<br />
Percentage<br />
from<br />
dem<strong>an</strong>d<br />
<strong>electricity</strong><br />
from storage<br />
April MWh<br />
daily <strong>electricity</strong> production 230.087<br />
daily <strong>electricity</strong> consumption 210.380<br />
0:00 7.855 1.680 155 1.443 3.290 1.403 – 7.971 115 – into/from daily storage 6.640<br />
1:00 7.324 1.680 155 1.443 3.290 1.403 – 7.971 647 – into <strong>an</strong>nual storage 19.707<br />
2:00 7.029 1.680 155 1.443 3.290 1.403 – 7.971 941 –<br />
3:00 6.812 1.680 155 1.443 3.290 1.403 – 7.971 1.159 –<br />
4:00 6.796 1.680 155 1.443 3.290 1.403 – 7.971 1.175 –<br />
5:00 7.402 1.680 155 1.443 3.290 1.403 – 7.971 568 –<br />
6:00 8.564 1.680 155 1.443 3.290 1.403 1.963 9.934 1.370 –<br />
7:00 9.855 1.680 155 1.443 3.290 1.403 4.350 12.321 2.466 –<br />
8:00 10.362 1.680 155 1.443 3.290 1.403 6.458 14.429 4.067 –<br />
9:00 10.509 1.680 155 1.443 3.290 1.403 8.164 16.135 5.626 –<br />
10:00 10.584 1.680 155 1.443 3.290 1.403 9.382 17.352 6.769 –<br />
11:00 10.836 1.680 155 1.443 3.290 1.403 10.079 18.050 7.214 –<br />
12:00 10.724 1.680 155 1.443 3.290 1.403 10.267 18.237 7.513 –<br />
13:00 10.410 1.680 155 1.443 3.290 1.403 9.945 17.916 7.505 –<br />
14:00 10.390 1.680 155 1.443 3.290 1.403 9.124 17.095 6.704 –<br />
15:00 10.233 1.680 155 1.443 3.290 1.403 7.778 15.748 5.515 –<br />
16:00 10.063 1.680 155 1.443 3.290 1.403 5.954 13.925 3.861 –<br />
17:00 9.842 1.680 155 1.443 3.290 1.403 3.782 11.752 1.910 –<br />
18:00 9.766 1.680 155 1.443 3.290 1.403 1.454 9.424 – -342 3,50% 321<br />
19:00 9.747 1.680 155 1.443 3.290 1.403 – 7.971 – -1.777 18,23% 1.649<br />
20:00 9.863 1.680 155 1.443 3.290 1.403 – 7.971 – -1.893 19,19% 1.766<br />
21:00 9.537 1.680 155 1.443 3.290 1.403 – 7.971 – -1.566 16,42% 1.419<br />
22:00 9.153 1.680 155 1.443 3.290 1.403 – 7.971 – -1.182 12,92% 1.080<br />
23:00 8.423 1.680 155 1.443 3.290 1.403 – 7.971 – -452 5,37% 405<br />
MIN 115 342 6.640 MWh ele dem<strong>an</strong>d from storage<br />
MAX 7.513 1.893<br />
legend: calculated from given data (const<strong>an</strong>t szenario)<br />
calculated from given data (growth szenario)<br />
over<strong>supply</strong><br />
shortage<br />
<strong>electricity</strong><br />
from storage<br />
(MWh)<br />
(MWh)