The relevance of energy storages for an autarky of electricity supply ...
The relevance of energy storages for an autarky of electricity supply ...
The relevance of energy storages for an autarky of electricity supply ...

You also want an ePaper? Increase the reach of your titles
YUMPU automatically turns print PDFs into web optimized ePapers that Google loves.
Hour<br />
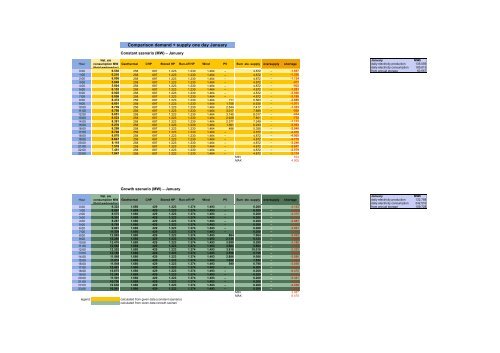
Comparison dem<strong>an</strong>d + <strong>supply</strong> one day J<strong>an</strong>uary<br />
J<strong>an</strong>uary MWh<br />
daily <strong>electricity</strong> production 135.059<br />
daily <strong>electricity</strong> consumption 185.615<br />
0:00 6.530 258 697 1.223 1.230 1.464 – 4.872 – -1.657 from <strong>an</strong>nual storage 50.557<br />
1:00 6.210 258 697 1.223 1.230 1.464 – 4.872 – -1.338<br />
2:00 6.006 258 697 1.223 1.230 1.464 – 4.872 – -1.134<br />
3:00 5.849 258 697 1.223 1.230 1.464 – 4.872 – -977<br />
4:00 5.804 258 697 1.223 1.230 1.464 – 4.872 – -932<br />
5:00 6.153 258 697 1.223 1.230 1.464 – 4.872 – -1.281<br />
6:00 6.928 258 697 1.223 1.230 1.464 – 4.872 – -2.056<br />
7:00 8.058 258 697 1.223 1.230 1.464 – 4.872 – -3.186<br />
8:00 8.472 258 697 1.223 1.230 1.464 711 5.583 – -2.888<br />
9:00 8.601 258 697 1.223 1.230 1.464 1.758 6.630 – -1.971<br />
10:00 8.739 258 697 1.223 1.230 1.464 2.544 7.417 – -1.323<br />
11:00 8.798 258 697 1.223 1.230 1.464 3.017 7.889 – -909<br />
12:00 8.651 258 697 1.223 1.230 1.464 3.145 8.017 – -634<br />
13:00 8.523 258 697 1.223 1.230 1.464 2.929 7.801 – -722<br />
14:00 8.381 258 697 1.223 1.230 1.464 2.377 7.249 – -1.132<br />
15:00 8.276 258 697 1.223 1.230 1.464 1.361 6.233 – -2.043<br />
16:00 8.298 258 697 1.223 1.230 1.464 486 5.358 – -2.940<br />
17:00 8.749 258 697 1.223 1.230 1.464 – 4.872 – -3.876<br />
18:00 8.878 258 697 1.223 1.230 1.464 – 4.872 – -4.005<br />
19:00 8.647 258 697 1.223 1.230 1.464 – 4.872 – -3.775<br />
20:00 8.118 258 697 1.223 1.230 1.464 – 4.872 – -3.246<br />
21:00 7.519 258 697 1.223 1.230 1.464 – 4.872 – -2.647<br />
22:00 7.451 258 697 1.223 1.230 1.464 – 4.872 – -2.579<br />
23:00 7.047 258 697 1.223 1.230 1.464 – 4.872 – -2.174<br />
MIN 634<br />
MAX 4.005<br />
Hour<br />
Nat. ele<br />
consumption MW<br />
(thrid wednesday)<br />
Nat. ele<br />
consumption MW<br />
(thrid wednesday)<br />
Const<strong>an</strong>t szenario (MW) – J<strong>an</strong>uary<br />
Geothermal CHP Stored HP Run-<strong>of</strong>f HP Wind PV Sum ele. <strong>supply</strong><br />
Growth szenario (MW) – J<strong>an</strong>uary<br />
Geothermal CHP Stored HP Run-<strong>of</strong>f HP Wind PV<br />
Sum ele. <strong>supply</strong> over<strong>supply</strong> shortage<br />
J<strong>an</strong>uary MWh<br />
daily <strong>electricity</strong> production 132.788<br />
daily <strong>electricity</strong> consumption 242.516<br />
0:00 9.323 1.680 429 1.223 1.374 1.493 – 6.200 – -3.123 from <strong>an</strong>nual storage 109.728<br />
1:00 8.867 1.680 429 1.223 1.374 1.493 – 6.200 – -2.666<br />
2:00 8.575 1.680 429 1.223 1.374 1.493 – 6.200 – -2.375<br />
3:00 8.351 1.680 429 1.223 1.374 1.493 – 6.200 – -2.151<br />
4:00 8.287 1.680 429 1.223 1.374 1.493 – 6.200 – -2.087<br />
5:00 8.785 1.680 429 1.223 1.374 1.493 – 6.200 – -2.585<br />
6:00 9.891 1.680 429 1.223 1.374 1.493 – 6.200 – -3.691<br />
7:00 11.504 1.680 429 1.223 1.374 1.493 – 6.200 – -5.304<br />
8:00 12.095 1.680 429 1.223 1.374 1.493 864 7.064 – -5.032<br />
9:00 12.280 1.680 429 1.223 1.374 1.493 2.135 8.335 – -3.945<br />
10:00 12.478 1.680 429 1.223 1.374 1.493 3.090 9.290 – -3.188<br />
11:00 12.562 1.680 429 1.223 1.374 1.493 3.664 9.864 – -2.698<br />
12:00 12.352 1.680 429 1.223 1.374 1.493 3.819 10.019 – -2.333<br />
13:00 12.169 1.680 429 1.223 1.374 1.493 3.556 9.756 – -2.413<br />
14:00 11.966 1.680 429 1.223 1.374 1.493 2.886 9.086 – -2.880<br />
15:00 11.816 1.680 429 1.223 1.374 1.493 1.652 7.852 – -3.964<br />
16:00 11.848 1.680 429 1.223 1.374 1.493 590 6.790 – -5.058<br />
17:00 12.491 1.680 429 1.223 1.374 1.493 – 6.200 – -6.291<br />
18:00 12.675 1.680 429 1.223 1.374 1.493 – 6.200 – -6.475<br />
19:00 12.345 1.680 429 1.223 1.374 1.493 – 6.200 – -6.145<br />
20:00 11.591 1.680 429 1.223 1.374 1.493 – 6.200 – -5.391<br />
21:00 10.736 1.680 429 1.223 1.374 1.493 – 6.200 – -4.536<br />
22:00 10.638 1.680 429 1.223 1.374 1.493 – 6.200 – -4.438<br />
23:00 10.061 1.680 429 1.223 1.374 1.493 – 6.200 – -3.861<br />
MIN 2.087<br />
MAX 6.475<br />
legend: calculated from given data (const<strong>an</strong>t szenario)<br />
calculated from given data (growth szenario)<br />
over<strong>supply</strong><br />
shortage