PV average daily <strong>electricity</strong> <strong>supply</strong> j<strong>an</strong>uary (MW/MWh) northerst point (49.020703°N, 15.020773°E) 1 estern point (48.006691°N, 17.160749°E) 1 southern point (46.372132°N, 14.563494°E) 1 western point (47.270581°N, 9.530768°E) 1 Time J<strong>an</strong>uary (N) J<strong>an</strong>uary (E) J<strong>an</strong>uary (S) J<strong>an</strong>uary (W) W/m 2 W/m 2 W/m 2 W/m 2 av. daily rad. J<strong>an</strong>uary W/m2 Installed capacity Technical potential area const<strong>an</strong>t szenario 3 17.675 MW 153,7 km2 6 growth szenario 4 21.463 MW 186,6 km2 5 average efficiency 7 11,5% 4:22 0:00 4:37 1:00 4:52 2:00 5:07 3:00 5:22 4:00 5:37 5:00 5:52 6:00 6:07 7:00 6:22 8:00 711,2 863,6 6:37 9:00 1.758,1 2.134,9 6:52 10:00 2.544,4 3.089,7 7:07 11:00 3.017,1 3.663,6 7:22 12:00 3.145,2 3.819,2 7:37 13:00 2.928,8 3.556,4 7:52 30 38 34,0 600,8 600,8 729,5 729,5 14:00 2.376,6 2.885,8 8:07 29 34 40 58 40,3 711,2 711,2 863,6 863,6 15:00 1.360,6 1.652,1 8:22 44 47 48 74 53,3 940,9 940,9 1.142,5 1.142,5 16:00 485,9 590,0 8:37 56 60 56 89 65,3 1.153,0 1.153,0 1.400,0 1.400,0 17:00 8:52 68 73 64 103 77,0 1.360,6 1.360,6 1.652,1 1.652,1 18:00 9:07 79 85 117 117 99,5 1.758,1 1.758,1 2.134,9 2.134,9 19:00 9:22 90 97 132 130 112,3 1.983,4 1.983,4 2.408,5 2.408,5 20:00 9:37 99 108 146 141 123,5 2.182,2 2.182,2 2.649,8 2.649,8 21:00 9:52 108 119 159 152 134,5 2.376,6 2.376,6 2.885,8 2.885,8 22:00 10:07 117 128 170 161 144,0 2.544,4 2.544,4 3.089,7 3.089,7 23:00 10:22 124 136 180 169 152,3 2.690,2 2.690,2 3.266,7 3.266,7 10:37 130 143 189 176 159,5 2.818,3 2.818,3 3.422,3 3.422,3 10:52 135 149 197 182 165,8 2.928,8 2.928,8 3.556,4 3.556,4 11:07 139 154 203 187 170,8 3.017,1 3.017,1 3.663,6 3.663,6 11:22 142 157 207 190 174,0 3.074,5 3.074,5 3.733,4 3.733,4 11:37 145 160 210 192 176,8 3.123,1 3.123,1 3.792,4 3.792,4 11:52 146 161 212 193 178,0 3.145,2 3.145,2 3.819,2 3.819,2 12:07 146 161 212 193 178,0 3.145,2 3.145,2 3.819,2 3.819,2 12:22 145 160 210 192 176,8 3.123,1 3.123,1 3.792,4 3.792,4 12:37 142 157 207 190 174,0 3.074,5 3.074,5 3.733,4 3.733,4 12:52 139 154 203 187 170,8 3.017,1 3.017,1 3.663,6 3.663,6 13:07 135 149 197 182 165,8 2.928,8 2.928,8 3.556,4 3.556,4 13:22 130 143 189 176 159,5 2.818,3 2.818,3 3.422,3 3.422,3 13:37 124 136 180 169 152,3 2.690,2 2.690,2 3.266,7 3.266,7 13:52 117 128 170 161 144,0 2.544,4 2.544,4 3.089,7 3.089,7 14:07 108 119 159 152 134,5 2.376,6 2.376,6 2.885,8 2.885,8 14:22 99 108 146 141 123,5 2.182,2 2.182,2 2.649,8 2.649,8 14:37 90 97 76 130 98,3 1.736,1 1.736,1 2.108,1 2.108,1 14:52 79 85 70 117 87,8 1.550,5 1.550,5 1.882,8 1.882,8 15:07 68 73 64 103 77,0 1.360,6 1.360,6 1.652,1 1.652,1 15:22 56 60 56 89 65,3 1.153,0 1.153,0 1.400,0 1.400,0 15:37 44 47 48 74 53,3 940,9 940,9 1.142,5 1.142,5 15:52 29 34 40 49 38,0 671,5 671,5 815,3 815,3 16:07 20 22 30 38 27,5 485,9 485,9 590,0 590,0 16:22 19 27 23,0 406,4 406,4 493,5 493,5 16:37 16:52 17:07 17:22 17:37 17:52 18:07 18:22 18:37 18:52 19:07 19:22 19:37 19:52 data from http://re.jrc.ec.europa.eu/pvgis/apps4/pvest.php data from feasibility study calculated from given data (feasibility study EA 2050) - const<strong>an</strong>t szenario calculated from given data (feasibility study EA 2050) - growth szenario total MW <strong>for</strong> whole area incl. Eff. PV Modules 2 PV ele. Generation MW (const<strong>an</strong>t) total MW <strong>for</strong> whole area incl. Eff. PV PV ele. Generation MW (growth) 1 http://toolserver.org/~geohack/geohack.php?pagename=Geographie_Österreichs&l<strong>an</strong>guage=de¶ms=46.372132_N_14.563494_E_region:AT-2_type:l<strong>an</strong>dmark&title=Südlichster+Punkt+Österreichs 2 Efficiencies assumed in feasibility study: between 7% <strong>an</strong>d 16% resulting in <strong>an</strong> average <strong>of</strong> 11,5% 3 ele generation from PV in const<strong>an</strong>t szenario = 70% <strong>of</strong> technical <strong>supply</strong> potential; 70% <strong>of</strong> average technical capacity potential (15,3 - 35,2 GW) is 17,7 GW 4 ele generation from PV in growth szenario = 85% <strong>of</strong> technical <strong>supply</strong> potential; 85% <strong>of</strong> average technical capacity potential (15,3 - 35,2 GW) is 21,5 GW 5 technical potential area = 219,5; 85% <strong>of</strong> area = 186,6 km 2 6 technical potential area = 219,5; 70% <strong>of</strong> area = 153,7 km 2 7 average efficiency <strong>of</strong> PV modules between 7% <strong>an</strong>d 16% (as stated in feasibility study EA 2050) Modules 2 Time PV ele. Generation MW (const<strong>an</strong>t) PV ele. Generation MW (growth)
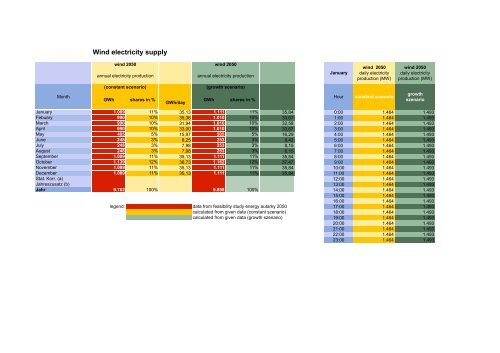
Month Wind <strong>electricity</strong> <strong>supply</strong> wind 2050 <strong>an</strong>nual <strong>electricity</strong> production (const<strong>an</strong>t scenario) GWh shares in % GWh/day wind 2050 <strong>an</strong>nual <strong>electricity</strong> production (growth scenario) GWh shares in % J<strong>an</strong>uary 1.089 11% 35,13 1.111 11% 35,84 0:00 1.464 1.493 Febuary 990 10% 35,36 1.010 10% 33,67 1:00 1.464 1.493 March 990 10% 31,94 1.010 10% 32,58 2:00 1.464 1.493 April 990 10% 33,00 1.010 10% 33,67 3:00 1.464 1.493 May 495 5% 15,97 505 5% 16,29 4:00 1.464 1.493 June 248 3% 8,25 253 3% 8,42 5:00 1.464 1.493 July 248 3% 7,98 253 3% 8,15 6:00 1.464 1.493 August 248 3% 7,98 253 3% 8,15 7:00 1.464 1.493 September 1.089 11% 35,13 1.111 11% 35,84 8:00 1.464 1.493 October 1.139 12% 36,73 1.162 12% 37,47 9:00 1.464 1.493 November 1.089 11% 35,13 1.111 11% 35,84 10:00 1.464 1.493 December 1.089 11% 35,13 1.111 11% 35,84 11:00 1.464 1.493 Stat. Korr. (a) 12:00 1.464 1.493 Jahreszusatz (b) 13:00 1.464 1.493 Jahr 9.702 100% 9.898 100% 14:00 1.464 1.493 15:00 1.464 1.493 16:00 1.464 1.493 legend: data from feasibility study <strong>energy</strong> <strong>autarky</strong> 2050 17:00 1.464 1.493 calculated from given data (const<strong>an</strong>t szenario) 18:00 1.464 1.493 calculated from given data (growth szenario) 19:00 1.464 1.493 20:00 1.464 1.493 21:00 1.464 1.493 22:00 1.464 1.493 23:00 1.464 1.493 J<strong>an</strong>uary wind 2050 daily <strong>electricity</strong> production (MW) Hour const<strong>an</strong>t szenario wind 2050 daily <strong>electricity</strong> production (MW) growth szenario