The relevance of energy storages for an autarky of electricity supply ...
The relevance of energy storages for an autarky of electricity supply ...
The relevance of energy storages for an autarky of electricity supply ...

You also want an ePaper? Increase the reach of your titles
YUMPU automatically turns print PDFs into web optimized ePapers that Google loves.
Hour<br />
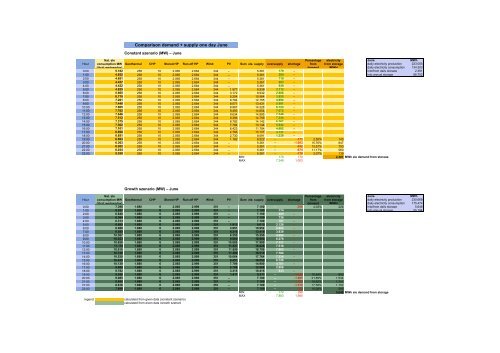
Comparison dem<strong>an</strong>d + <strong>supply</strong> one day June<br />
June MWh<br />
daily <strong>electricity</strong> production 223.055<br />
daily <strong>electricity</strong> consumption 134.303<br />
0:00 5.182 258 10 2.065 2.684 344 – 5.361 179 – into/from daily storage 2.391<br />
1:00 4.852 258 10 2.065 2.684 344 – 5.361 509 – into <strong>an</strong>nual storage 88.752<br />
2:00 4.651 258 10 2.065 2.684 344 – 5.361 710 –<br />
3:00 4.457 258 10 2.065 2.684 344 – 5.361 903 –<br />
4:00 4.422 258 10 2.065 2.684 344 – 5.361 939 –<br />
5:00 4.825 258 10 2.065 2.684 344 1.577 6.938 2.112 –<br />
6:00 5.665 258 10 2.065 2.684 344 3.172 8.532 2.868 –<br />
7:00 6.710 258 10 2.065 2.684 344 5.204 10.564 3.855 –<br />
8:00 7.261 258 10 2.065 2.684 344 6.794 12.155 4.894 –<br />
9:00 7.440 258 10 2.065 2.684 344 8.071 13.431 5.991 –<br />
10:00 7.605 258 10 2.065 2.684 344 8.967 14.328 6.723 –<br />
11:00 7.782 258 10 2.065 2.684 344 9.493 14.854 7.072 –<br />
12:00 7.646 258 10 2.065 2.684 344 9.634 14.995 7.349 –<br />
13:00 7.512 258 10 2.065 2.684 344 9.396 14.756 7.244 –<br />
14:00 7.375 258 10 2.065 2.684 344 8.782 14.142 6.767 –<br />
15:00 7.302 258 10 2.065 2.684 344 7.784 13.144 5.842 –<br />
16:00 7.101 258 10 2.065 2.684 344 6.423 11.784 4.682 –<br />
17:00 6.990 258 10 2.065 2.684 344 4.766 10.127 3.137 –<br />
18:00 6.851 258 10 2.065 2.684 344 2.730 8.091 1.239 –<br />
19:00 6.693 258 10 2.065 2.684 344 1.162 6.522 – -171 2,55% 143<br />
20:00 6.363 258 10 2.065 2.684 344 – 5.361 – -1.003 15,76% 847<br />
21:00 6.202 258 10 2.065 2.684 344 – 5.361 – -842 13,57% 703<br />
22:00 6.034 258 10 2.065 2.684 344 – 5.361 – -674 11,17% 560<br />
23:00 5.530 258 10 2.065 2.684 344 – 5.361 – -170 3,07% 139<br />
MIN 179 170 2.391 MWh ele dem<strong>an</strong>d from storage<br />
MAX 7.349 1.003<br />
Hour<br />
Nat. ele<br />
consumption MW<br />
(thrid wednesday)<br />
Nat. ele<br />
consumption MW<br />
(thrid wednesday)<br />
Const<strong>an</strong>t szenario (MW) – June<br />
Geothermal CHP Stored HP<br />
Growth szenario (MW) – June<br />
Geothermal CHP Stored HP<br />
Run-<strong>of</strong>f HP Wind<br />
PV Sum ele. <strong>supply</strong><br />
Run-<strong>of</strong>f HP Wind PV Sum ele. <strong>supply</strong> over<strong>supply</strong> shortage<br />
Percentage<br />
from<br />
dem<strong>an</strong>d<br />
Percentage<br />
from<br />
dem<strong>an</strong>d<br />
<strong>electricity</strong><br />
from storage<br />
June MWh<br />
daily <strong>electricity</strong> production 230.668<br />
daily <strong>electricity</strong> consumption 175.474<br />
0:00 7.398 1.680 6 2.065 2.999 351 – 7.100 – -298 4,03% 226 into/from daily storage 5.648<br />
1:00 6.927 1.680 6 2.065 2.999 351 – 7.100 174 – into <strong>an</strong>nual storage 55.194<br />
2:00 6.640 1.680 6 2.065 2.999 351 – 7.100 460 –<br />
3:00 6.364 1.680 6 2.065 2.999 351 – 7.100 736 –<br />
4:00 6.313 1.680 6 2.065 2.999 351 – 7.100 787 –<br />
5:00 6.889 1.680 6 2.065 2.999 351 1.915 9.015 2.126 –<br />
6:00 8.088 1.680 6 2.065 2.999 351 3.851 10.952 2.864 –<br />
7:00 9.580 1.680 6 2.065 2.999 351 6.319 13.419 3.839 –<br />
8:00 10.367 1.680 6 2.065 2.999 351 8.250 15.350 4.984 –<br />
9:00 10.623 1.680 6 2.065 2.999 351 9.800 16.900 6.278 –<br />
10:00 10.858 1.680 6 2.065 2.999 351 10.889 17.989 7.131 –<br />
11:00 11.110 1.680 6 2.065 2.999 351 11.527 18.628 7.518 –<br />
12:00 10.916 1.680 6 2.065 2.999 351 11.699 18.799 7.883 –<br />
13:00 10.726 1.680 6 2.065 2.999 351 11.409 18.510 7.784 –<br />
14:00 10.530 1.680 6 2.065 2.999 351 10.664 17.764 7.234 –<br />
15:00 10.425 1.680 6 2.065 2.999 351 9.451 16.552 6.126 –<br />
16:00 10.139 1.680 6 2.065 2.999 351 7.799 14.900 4.761 –<br />
17:00 9.980 1.680 6 2.065 2.999 351 5.788 12.888 2.908 –<br />
18:00 9.782 1.680 6 2.065 2.999 351 3.315 10.415 633 –<br />
19:00 9.556 1.680 6 2.065 2.999 351 1.411 8.511 – -1.045 10,94% 800<br />
20:00 9.085 1.680 6 2.065 2.999 351 – 7.100 – -1.985 21,85% 1.534<br />
21:00 8.855 1.680 6 2.065 2.999 351 – 7.100 – -1.755 19,82% 1.341<br />
22:00 8.616 1.680 6 2.065 2.999 351 – 7.100 – -1.515 17,59% 1.152<br />
23:00 7.896 1.680 6 2.065 2.999 351 – 7.100 – -796 10,08% 595<br />
MIN 174 298 5.648 MWh ele dem<strong>an</strong>d from storage<br />
MAX 7.883 1.985<br />
legend: calculated from given data (const<strong>an</strong>t szenario)<br />
calculated from given data (growth szenario)<br />
over<strong>supply</strong><br />
shortage<br />
<strong>electricity</strong><br />
from storage<br />
(MWh)<br />
(MWh)