The relevance of energy storages for an autarky of electricity supply ...
The relevance of energy storages for an autarky of electricity supply ...
The relevance of energy storages for an autarky of electricity supply ...

You also want an ePaper? Increase the reach of your titles
YUMPU automatically turns print PDFs into web optimized ePapers that Google loves.
Hour<br />
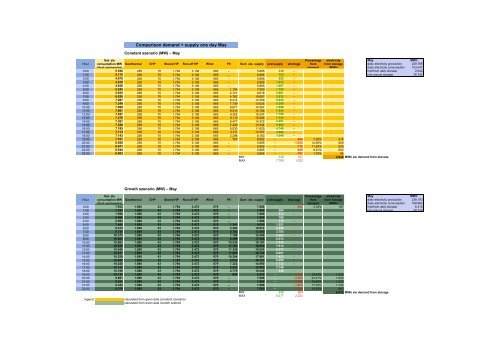
Comparison dem<strong>an</strong>d + <strong>supply</strong> one day May<br />
May MWh<br />
daily <strong>electricity</strong> production 229.789<br />
daily <strong>electricity</strong> consumption 153.047<br />
0:00 5.556 258 70 1.794 3.108 665 – 5.895 339 – into/from daily storage 2.642<br />
1:00 5.172 258 70 1.794 3.108 665 – 5.895 723 – into <strong>an</strong>nual storage 76.742<br />
2:00 4.970 258 70 1.794 3.108 665 – 5.895 925 –<br />
3:00 4.819 258 70 1.794 3.108 665 – 5.895 1.076 –<br />
4:00 4.828 258 70 1.794 3.108 665 – 5.895 1.067 –<br />
5:00 5.244 258 70 1.794 3.108 665 1.104 7.000 1.755 –<br />
6:00 5.935 258 70 1.794 3.108 665 2.721 8.616 2.681 –<br />
7:00 6.826 258 70 1.794 3.108 665 4.762 10.657 3.832 –<br />
8:00 7.267 258 70 1.794 3.108 665 6.414 12.309 5.043 –<br />
9:00 7.349 258 70 1.794 3.108 665 7.739 13.635 6.286 –<br />
10:00 7.468 258 70 1.794 3.108 665 8.671 14.567 7.098 –<br />
11:00 7.661 258 70 1.794 3.108 665 9.210 15.106 7.444 –<br />
12:00 7.457 258 70 1.794 3.108 665 9.352 15.247 7.790 –<br />
13:00 7.478 258 70 1.794 3.108 665 9.113 15.008 7.530 –<br />
14:00 7.381 258 70 1.794 3.108 665 8.477 14.372 6.991 –<br />
15:00 7.349 258 70 1.794 3.108 665 7.439 13.334 5.985 –<br />
16:00 7.185 258 70 1.794 3.108 665 6.030 11.925 4.740 –<br />
17:00 7.113 258 70 1.794 3.108 665 4.311 10.207 3.094 –<br />
18:00 7.143 258 70 1.794 3.108 665 2.288 8.183 1.040 –<br />
19:00 7.101 258 70 1.794 3.108 665 707 6.602 – -499 7,03% 414<br />
20:00 6.928 258 70 1.794 3.108 665 – 5.895 – -1.032 14,90% 859<br />
21:00 6.671 258 70 1.794 3.108 665 – 5.895 – -776 11,63% 633<br />
22:00 6.544 258 70 1.794 3.108 665 – 5.895 – -649 9,91% 652<br />
23:00 6.003 258 70 1.794 3.108 665 – 5.895 – -107 1,79% 84<br />
MIN 339 107 2.642 MWh ele dem<strong>an</strong>d from storage<br />
MAX 7.790 1.032<br />
Hour<br />
Nat. ele<br />
consumption MW<br />
(thrid wednesday)<br />
Const<strong>an</strong>t szenario (MW) – May<br />
Geothermal CHP Stored HP<br />
Growth szenario (MW) – May<br />
Nat. ele<br />
consumption MW Geothermal<br />
(thrid wednesday)<br />
CHP Stored HP<br />
Run-<strong>of</strong>f HP Wind<br />
PV Sum ele. <strong>supply</strong><br />
<strong>electricity</strong><br />
from storage<br />
(MWh)<br />
May MWh<br />
daily <strong>electricity</strong> production 238.193<br />
daily <strong>electricity</strong> consumption 199.964<br />
0:00 7.932 1.680 43 1.794 3.472 679 – 7.668 – -264 3,33% 197 into/from daily storage 6.412<br />
1:00 7.384 1.680 43 1.794 3.472 679 – 7.668 284 – into <strong>an</strong>nual storage 38.229<br />
2:00 7.096 1.680 43 1.794 3.472 679 – 7.668 572 –<br />
3:00 6.880 1.680 43 1.794 3.472 679 – 7.668 788 –<br />
4:00 6.893 1.680 43 1.794 3.472 679 – 7.668 775 –<br />
5:00 7.488 1.680 43 1.794 3.472 679 1.341 9.009 1.521 –<br />
6:00 8.474 1.680 43 1.794 3.472 679 3.304 10.972 2.498 –<br />
7:00 9.745 1.680 43 1.794 3.472 679 5.782 13.450 3.705 –<br />
8:00 10.375 1.680 43 1.794 3.472 679 7.789 15.456 5.082 –<br />
9:00 10.492 1.680 43 1.794 3.472 679 9.398 17.066 6.574 –<br />
10:00 10.663 1.680 43 1.794 3.472 679 10.530 18.197 7.535 –<br />
11:00 10.939 1.680 43 1.794 3.472 679 11.184 18.852 7.913 –<br />
12:00 10.646 1.680 43 1.794 3.472 679 11.356 19.024 8.377 –<br />
13:00 10.677 1.680 43 1.794 3.472 679 11.066 18.734 8.057 –<br />
14:00 10.539 1.680 43 1.794 3.472 679 10.294 17.961 7.423 –<br />
15:00 10.492 1.680 43 1.794 3.472 679 9.033 16.701 6.209 –<br />
16:00 10.258 1.680 43 1.794 3.472 679 7.322 14.990 4.732 –<br />
17:00 10.155 1.680 43 1.794 3.472 679 5.235 12.903 2.748 –<br />
18:00 10.198 1.680 43 1.794 3.472 679 2.779 10.446 248 –<br />
19:00 10.139 1.680 43 1.794 3.472 679 858 8.526 – -1.613 15,91% 1.223<br />
20:00 9.891 1.680 43 1.794 3.472 679 – 7.668 – -2.223 22,47% 1.693<br />
21:00 9.524 1.680 43 1.794 3.472 679 – 7.668 – -1.856 19,49% 1.387<br />
22:00 9.343 1.680 43 1.794 3.472 679 – 7.668 – -1.675 17,93% 1.245<br />
23:00 8.570 1.680 43 1.794 3.472 679 – 7.668 – -902 10,53% 667<br />
MIN 248 264 6.412 MWh ele dem<strong>an</strong>d from storage<br />
MAX 8.377 2.223<br />
legend: calculated from given data (const<strong>an</strong>t szenario)<br />
calculated from given data (growth szenario)<br />
over<strong>supply</strong><br />
shortage<br />
Run-<strong>of</strong>f HP Wind PV Sum ele. <strong>supply</strong> over<strong>supply</strong> shortage<br />
Percentage<br />
from<br />
dem<strong>an</strong>d<br />
Percentage<br />
from<br />
dem<strong>an</strong>d<br />
<strong>electricity</strong><br />
from storage<br />
(MWh)