The relevance of energy storages for an autarky of electricity supply ...
The relevance of energy storages for an autarky of electricity supply ...
The relevance of energy storages for an autarky of electricity supply ...

You also want an ePaper? Increase the reach of your titles
YUMPU automatically turns print PDFs into web optimized ePapers that Google loves.
Hour<br />
Nat. ele<br />
consumption MW<br />
(thrid wednesday)<br />
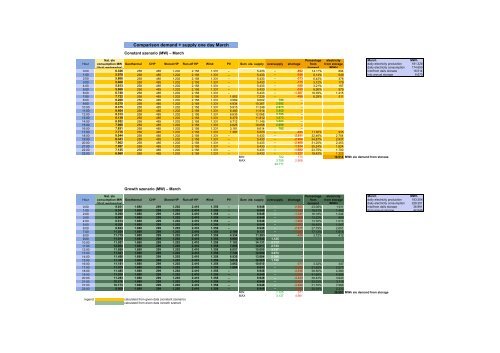
Comparison dem<strong>an</strong>d + <strong>supply</strong> one day March<br />
March MWh<br />
daily <strong>electricity</strong> production 181.328<br />
daily <strong>electricity</strong> consumption 174.659<br />
0:00 6.326 258 485 1.202 2.158 1.331 – 5.433 – -892 14,11% 894 into/from daily storage 18.514<br />
1:00 5.979 258 485 1.202 2.158 1.331 – 5.433 – -546 9,14% 549 into <strong>an</strong>nual storage 6.670<br />
2:00 5.806 258 485 1.202 2.158 1.331 – 5.433 – -373 6,42% 378<br />
3:00 5.608 258 485 1.202 2.158 1.331 – 5.433 – -175 3,12% 179<br />
4:00 5.613 258 485 1.202 2.158 1.331 – 5.433 – -180 3,21% 187<br />
5:00 5.968 258 485 1.202 2.158 1.331 – 5.433 – -535 8,96% 575<br />
6:00 6.740 258 485 1.202 2.158 1.331 – 5.433 – -1.307 19,39% 1.415<br />
7:00 7.722 258 485 1.202 2.158 1.331 1.802 7.235 – -486 6,29% 511<br />
8:00 8.208 258 485 1.202 2.158 1.331 3.569 9.002 795 –<br />
9:00 8.275 258 485 1.202 2.158 1.331 4.934 10.367 2.092 –<br />
10:00 8.375 258 485 1.202 2.158 1.331 5.915 11.348 2.973 –<br />
11:00 8.464 258 485 1.202 2.158 1.331 6.480 11.914 3.450 –<br />
12:00 8.313 258 485 1.202 2.158 1.331 6.635 12.068 3.755 –<br />
13:00 8.139 258 485 1.202 2.158 1.331 6.379 11.812 3.673 –<br />
14:00 8.052 258 485 1.202 2.158 1.331 5.712 11.145 3.093 –<br />
15:00 7.960 258 485 1.202 2.158 1.331 4.625 10.058 2.098 –<br />
16:00 7.831 258 485 1.202 2.158 1.331 3.181 8.614 782 –<br />
17:00 7.715 258 485 1.202 2.158 1.331 1.387 6.820 – -895 11,60% 935<br />
18:00 8.044 258 485 1.202 2.158 1.331 – 5.433 – -2.611 32,46% 2.754<br />
19:00 8.341 258 485 1.202 2.158 1.331 – 5.433 – -2.908 34,87% 2.937<br />
20:00 7.902 258 485 1.202 2.158 1.331 – 5.433 – -2.469 31,25% 2.453<br />
21:00 7.267 258 485 1.202 2.158 1.331 – 5.433 – -1.834 25,24% 1.824<br />
22:00 7.125 258 485 1.202 2.158 1.331 – 5.433 – -1.692 23,75% 1.700<br />
23:00 6.660 258 485 1.202 2.158 1.331 – 5.433 – -1.227 18,42% 1.222<br />
MIN 782 175 18.514 MWh ele dem<strong>an</strong>d from storage<br />
MAX 3.755<br />
22.711<br />
2.908<br />
Hour<br />
Nat. ele<br />
consumption MW<br />
(thrid wednesday)<br />
Const<strong>an</strong>t szenario (MW) – March<br />
Geothermal CHP Stored HP Run-<strong>of</strong>f HP Wind PV Sum ele. <strong>supply</strong><br />
Growth szenario (MW) – March<br />
Geothermal CHP Stored HP<br />
Run-<strong>of</strong>f HP<br />
Wind PV<br />
Sum ele. <strong>supply</strong> over<strong>supply</strong><br />
March MWh<br />
daily <strong>electricity</strong> production 183.554<br />
daily <strong>electricity</strong> consumption 228.201<br />
0:00 9.031 1.680 299 1.202 2.410 1.358 – 6.948 – -2.083 23,06% 1.911 into/from daily storage 36.991<br />
1:00 8.537 1.680 299 1.202 2.410 1.358 – 6.948 – -1.589 18,61% 1.462 from <strong>an</strong>nual storage 44.646<br />
2:00 8.290 1.680 299 1.202 2.410 1.358 – 6.948 – -1.341 16,18% 1.244<br />
3:00 8.007 1.680 299 1.202 2.410 1.358 – 6.948 – -1.059 13,22% 990<br />
4:00 8.014 1.680 299 1.202 2.410 1.358 – 6.948 – -1.066 13,30% 1.013<br />
5:00 8.520 1.680 299 1.202 2.410 1.358 – 6.948 – -1.572 18,45% 1.547<br />
6:00 9.623 1.680 299 1.202 2.410 1.358 – 6.948 – -2.675 27,79% 2.651<br />
7:00 11.024 1.680 299 1.202 2.410 1.358 2.189 9.137 – -1.887 17,12% 1.815<br />
8:00 11.719 1.680 299 1.202 2.410 1.358 4.334 11.283 – -436 3,72% 412<br />
9:00 11.815 1.680 299 1.202 2.410 1.358 5.992 12.940 1.125 –<br />
10:00 11.957 1.680 299 1.202 2.410 1.358 7.182 14.131 2.173 –<br />
11:00 12.084 1.680 299 1.202 2.410 1.358 7.869 14.817 2.733 –<br />
12:00 11.869 1.680 299 1.202 2.410 1.358 8.057 15.005 3.137 –<br />
13:00 11.621 1.680 299 1.202 2.410 1.358 7.746 14.694 3.073 –<br />
14:00 11.496 1.680 299 1.202 2.410 1.358 6.936 13.884 2.388 –<br />
15:00 11.365 1.680 299 1.202 2.410 1.358 5.616 12.565 1.199 –<br />
16:00 11.181 1.680 299 1.202 2.410 1.358 3.862 10.810 – -371 3,32% 347<br />
17:00 11.015 1.680 299 1.202 2.410 1.358 1.684 8.633 – -2.383 21,63% 2.277<br />
18:00 11.485 1.680 299 1.202 2.410 1.358 – 6.948 – -4.536 39,50% 4.380<br />
19:00 11.910 1.680 299 1.202 2.410 1.358 – 6.948 – -4.961 41,66% 4.585<br />
20:00 11.283 1.680 299 1.202 2.410 1.358 – 6.948 – -4.334 38,42% 3.940<br />
21:00 10.376 1.680 299 1.202 2.410 1.358 – 6.948 – -3.427 33,03% 3.119<br />
22:00 10.173 1.680 299 1.202 2.410 1.358 – 6.948 – -3.224 31,70% 2.966<br />
23:00 9.509 1.680 299 1.202 2.410 1.358 – 6.948 – -2.561 26,93% 2.333<br />
MIN 1.125 371 36.991 MWh ele dem<strong>an</strong>d from storage<br />
MAX 3.137 4.961<br />
legend: calculated from given data (const<strong>an</strong>t szenario)<br />
calculated from given data (growth szenario)<br />
over<strong>supply</strong><br />
shortage<br />
shortage<br />
Percentage<br />
from<br />
dem<strong>an</strong>d<br />
Percentage<br />
from<br />
dem<strong>an</strong>d<br />
<strong>electricity</strong><br />
from storage<br />
(MWh)<br />
<strong>electricity</strong><br />
from storage<br />
(MWh)