Sustainable Value Report 2001/2002 - BMW Group
Sustainable Value Report 2001/2002 - BMW Group
Sustainable Value Report 2001/2002 - BMW Group

Create successful ePaper yourself
Turn your PDF publications into a flip-book with our unique Google optimized e-Paper software.
Overview of <strong>BMW</strong> <strong>Group</strong> Figures<br />
www.bmwgroup.com/sustainability <strong>BMW</strong> <strong>Group</strong> Figures<br />
Automobile Assembly,<br />
Dingolfing, Germany<br />
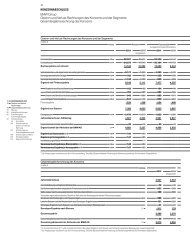
<strong>BMW</strong> <strong>Group</strong> Figures*<br />
Vehicle Production<br />
* <strong>BMW</strong> <strong>Group</strong> figures apply to the following car and engine manufacturing facilities: Automobile Assembly, Dingolfing; Component Assembly,<br />
Landshut; Automobile Production and Engine Assembly, Munich; Automobile Production, Regensburg; Automobile Production, Rosslyn,<br />
South Africa; Automobile Production, Spartanburg, USA; Engine Assembly, Steyr, Austria.<br />
** Number of registered industrial accidents per 1 million man-hours.<br />
*** Increase since 1998 resulting from outdated CDP dryer in Munich paint shop. Completion of new building and pretreatment facility<br />
scheduled for <strong>2002</strong>.<br />
**** Survey conducted every two years.<br />
***** Includes CO 2 emissions of external electricity production.<br />
50<br />
Component Assembly,<br />
Landshut, Germany<br />
Automobile Production and Engine Assembly,<br />
Munich<br />
1996 1997 1998 1999 2000<br />
<strong>BMW</strong> automobiles Units 639,433 672,238 706,426 755,547 834,519<br />
Manufactured engines Units 640,940 672,962 713,329 792,026 876,656<br />
Personnel in production No. 44,600 44,465 47,137 48,543 50,300<br />
Frequency of industrial accidents** No. 24 16 15 14 17<br />
Complaints from local residents*** No. 10 28 47 86 74<br />
Land development**** % -- 20 -- 24.6 --<br />
Property area m 2 -- 11,923,975 -- 12,491,329 --<br />
Emissions<br />
Carbon dioxide (CO 2)***** t 786,879 780,271 803,386 833,232 870,862<br />
CO 2 per unit produced t/unit 1.23 1.16 1.14 1.10 1.04<br />
Nitrogen oxide (NO x) t 808 854 987 875 476<br />
SO 2 t 11 7 4 5 6<br />
Carbon monoxide (CO) t 218 211 279 275 244<br />
Volatile organic compounds (VOC) t 2,872 2,354 2,636 2,870 2,679<br />
VOC per unit produced kg/unit 4.49 3.50 3.73 3.80 3.21<br />
Particles, dust t 39 34 33 35 37<br />
Water<br />
CO 2 emissions per unit produced<br />
in tons<br />
Wastewater total m 3 2,231,194 1,985,842 2,340,409 2,131,837 2,206,733<br />
Water consumption/water input m 3 3,736,900 3,468,948 3,423,820 3,403,209 3,344,939<br />
Process water input m 3 2,917,520 2,717,549 2,737,398 2,650,677 2,481,127<br />
Process wastewater m 3 809,988 853,241 870,815 868,044 882,286<br />
Process wastewater m3 per unit produced<br />
1.27 1.27 1.23 1.15 1.06<br />
Total heavy metals and<br />
heavy metal compounds<br />
kg 344 301 400 383 318<br />
1.3<br />
1.2<br />
1.1<br />
1.0<br />
0.9<br />
’96 ’97 ’98 ’99 ’00<br />
1.23 1.16 1.14 1.10 1.04

![Vollständiger Bericht [PDF] - BMW Group](https://img.yumpu.com/20706531/1/190x238/vollstandiger-bericht-pdf-bmw-group.jpg?quality=85)