A Wavelength Converter Integrated with a Discretely Tunable Laser ...
A Wavelength Converter Integrated with a Discretely Tunable Laser ...
A Wavelength Converter Integrated with a Discretely Tunable Laser ...

Create successful ePaper yourself
Turn your PDF publications into a flip-book with our unique Google optimized e-Paper software.
8.4 Static measurements 117<br />
Control<br />
DFB EDFA PLC ATT<br />
SOA mwl<br />
SOApre<br />
CW<br />
SOA 1<br />
SOA 2<br />
InP chip<br />
α<br />
Fiber<br />
Array<br />
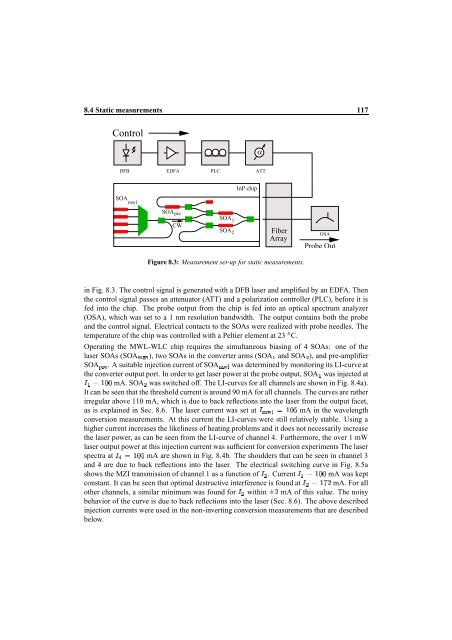
Figure 8.3: Measurement set-up for static measurements.<br />
OSA<br />
Probe Out<br />
in Fig. 8.3. The control signal is generated <strong>with</strong> a DFB laser and amplified by an EDFA. Then<br />
the control signal passes an attenuator (ATT) and a polarization controller (PLC), before it is<br />
fed into the chip. The probe output from the chip is fed into an optical spectrum analyzer<br />
(OSA), which was set to a 1 nm resolution bandwidth. The output contains both the probe<br />
and the control signal. Electrical contacts to the SOAs were realized <strong>with</strong> probe needles. The<br />
temperature of the chip was controlled <strong>with</strong> a Peltier element at 23 C.<br />
Operating the MWL-WLC chip requires the simultaneous biasing of 4 SOAs: one of the<br />
laser SOAs (SOA ), two SOAs in the converter arms (SOA and SOA ¦ ), and pre-amplifier<br />
SOA . A suitable injection current of SOA was determined by monitoring its LI-curve at<br />
the converter output port. In order to get laser power at the probe output, SOA was injected at<br />
¤ mA. SOA ¦ was switched off. The LI-curves for all channels are shown in Fig. 8.4a).<br />
It can be seen that the threshold current is around 90 mA for all channels. The curves are rather<br />
irregular above 110 mA, which is due to back reflections into the laser from the output facet,<br />
as is explained in Sec. 8.6. The laser current was set at ¤¨ mA in the wavelength<br />
conversion measurements. At this current the LI-curves were still relatively stable. Using a<br />
higher current increases the likeliness of heating problems and it does not necessarily increase<br />
the laser power, as can be seen from the LI-curve of channel 4. Furthermore, the over 1 mW<br />
laser output power at this injection current was sufficient for conversion experiments The laser<br />
<br />
¤¨ spectra at mA are shown in Fig. 8.4b. The shoulders that can be seen in channel 3<br />
and 4 are due to back reflections into the laser. The electrical switching curve in Fig. 8.5a<br />
shows the MZI transmission of channel 1 as a ¦ function of . Current mA was kept<br />
¤<br />
constant. It can be seen that optimal destructive interference is <br />
¦ ¤ found at mA. For all<br />
other channels, a similar minimum was ¦ found for <strong>with</strong>in mA of this value. The noisy<br />
behavior of the curve is due to back reflections into the laser (Sec. 8.6). The above described<br />
injection currents were used in the non-inverting conversion measurements that are described<br />
below.