Panalpina Annual Report 2006
Panalpina Annual Report 2006
Panalpina Annual Report 2006

Create successful ePaper yourself
Turn your PDF publications into a flip-book with our unique Google optimized e-Paper software.
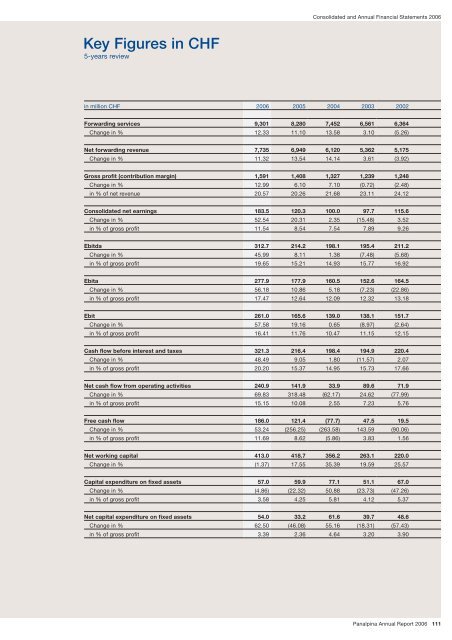
Key Figures in CHF<br />
5-years review<br />
Consolidated and <strong>Annual</strong> Financial Statements <strong>2006</strong><br />
in million CHF <strong>2006</strong> 2005 2004 2003 2002<br />
Forwarding services 9,301 8,280 7,452 6,561 6,364<br />
Change in % 12.33 11.10 13.58 3.10 (5.26)<br />
Net forwarding revenue 7,735 6,949 6,120 5,362 5,175<br />
Change in % 11.32 13.54 14.14 3.61 (3.92)<br />
Gross profit (contribution margin) 1,591 1,408 1,327 1,239 1,248<br />
Change in % 12.99 6.10 7.10 (0.72) (2.48)<br />
in % of net revenue 20.57 20.26 21.68 23.11 24.12<br />
Consolidated net earnings 183.5 120.3 100.0 97.7 115.6<br />
Change in % 52.54 20.31 2.35 (15.48) 3.52<br />
in % of gross profit 11.54 8.54 7.54 7.89 9.26<br />
Ebitda 312.7 214.2 198.1 195.4 211.2<br />
Change in % 45.99 8.11 1.38 (7.48) (5.68)<br />
in % of gross profit 19.65 15.21 14.93 15.77 16.92<br />
Ebita 277.9 177.9 160.5 152.6 164.5<br />
Change in % 56.18 10.86 5.18 (7.23) (22.86)<br />
in % of gross profit 17.47 12.64 12.09 12.32 13.18<br />
Ebit 261.0 165.6 139.0 138.1 151.7<br />
Change in % 57.58 19.16 0.65 (8.97) (2.64)<br />
in % of gross profit 16.41 11.76 10.47 11.15 12.15<br />
Cash flow before interest and taxes 321.3 216.4 198.4 194.9 220.4<br />
Change in % 48.49 9.05 1.80 (11.57) 2.07<br />
in % of gross profit 20.20 15.37 14.95 15.73 17.66<br />
Net cash flow from operating activities 240.9 141.9 33.9 89.6 71.9<br />
Change in % 69.83 318.48 (62.17) 24.62 (77.99)<br />
in % of gross profit 15.15 10.08 2.55 7.23 5.76<br />
Free cash flow 186.0 121.4 (77.7) 47.5 19.5<br />
Change in % 53.24 (256.25) (263.58) 143.59 (90.06)<br />
in % of gross profit 11.69 8.62 (5.86) 3.83 1.56<br />
Net working capital 413.0 418.7 356.2 263.1 220.0<br />
Change in % (1.37) 17.55 35.39 19.59 25.57<br />
Capital expenditure on fixed assets 57.0 59.9 77.1 51.1 67.0<br />
Change in % (4.86) (22.32) 50.88 (23.73) (47.26)<br />
in % of gross profit 3.58 4.25 5.81 4.12 5.37<br />
Net capital expenditure on fixed assets 54.0 33.2 61.6 39.7 48.6<br />
Change in % 62.50 (46.08) 55.16 (18.31) (57.43)<br />
in % of gross profit 3.39 2.36 4.64 3.20 3.90<br />
<strong>Panalpina</strong> <strong>Annual</strong> <strong>Report</strong> <strong>2006</strong> 111
![Eigenes Luftfrachtnetzwerk [pdf | 244 KB] - Panalpina](https://img.yumpu.com/23347328/1/184x260/eigenes-luftfrachtnetzwerk-pdf-244-kb-panalpina.jpg?quality=85)
![Übersicht Panalpina [pdf | 240 KB]](https://img.yumpu.com/22547731/1/184x260/ubersicht-panalpina-pdf-240-kb.jpg?quality=85)
![Seefracht [pdf | 181 KB] - Panalpina](https://img.yumpu.com/22234724/1/184x260/seefracht-pdf-181-kb-panalpina.jpg?quality=85)


![Annual Report 2012 [pdf | 1 MB] - Panalpina](https://img.yumpu.com/15342099/1/184x260/annual-report-2012-pdf-1-mb-panalpina.jpg?quality=85)