Panalpina Annual Report 2006
Panalpina Annual Report 2006
Panalpina Annual Report 2006

Create successful ePaper yourself
Turn your PDF publications into a flip-book with our unique Google optimized e-Paper software.
<strong>Report</strong> of the Executive Board<br />
18 <strong>Panalpina</strong> <strong>Annual</strong> <strong>Report</strong> <strong>2006</strong><br />
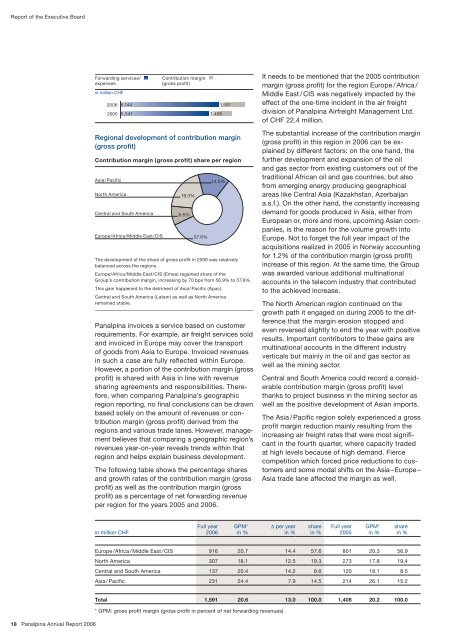
Forwarding services/<br />
expenses<br />
in million CHF<br />
<strong>2006</strong><br />
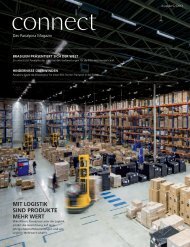
Contribution margin (gross profit) share per region<br />
Asia/Pacific<br />
North America<br />
6,144<br />
2005<br />
5,541<br />
Central and South America<br />
Europe/Africa/Middle East/CIS<br />
in million CHF<br />
Contribution margin<br />
(gross profit)<br />
19.3%<br />
8.6%<br />
57.6%<br />
1,408<br />
14.5%<br />
The development of the share of gross profit in <strong>2006</strong> was relatively<br />
balanced across the regions.<br />
Europe/Africa/Middle East/CIS (Emea) regained share of the<br />
Group’s contribution margin, increasing by 70 bps from 56.9% to 57.6%.<br />
This gain happened to the detriment of Asia/Pacific (Apac).<br />
Central and South America (Latam) as well as North America<br />
remained stable.<br />
Full year<br />
<strong>2006</strong><br />
1,591<br />
Regional development of contribution margin<br />
(gross profit)<br />
<strong>Panalpina</strong> invoices a service based on customer<br />
requirements. For example, air freight services sold<br />
and invoiced in Europe may cover the transport<br />
of goods from Asia to Europe. Invoiced revenues<br />
in such a case are fully reflected within Europe.<br />
However, a portion of the contribution margin (gross<br />
profit) is shared with Asia in line with revenue<br />
sharing agreements and responsibilities. Therefore,<br />
when comparing <strong>Panalpina</strong>’s geographic<br />
region reporting, no final conclusions can be drawn<br />
based solely on the amount of revenues or contribution<br />
margin (gross profit) derived from the<br />
regions and various trade lanes. However, management<br />
believes that comparing a geographic region’s<br />
revenues yearonyear reveals trends within that<br />
region and helps explain business development.<br />
The following table shows the percentage shares<br />
and growth rates of the contribution margin (gross<br />
profit) as well as the contribution margin (gross<br />
profit) as a percentage of net forwarding revenue<br />
per region for the years 2005 and <strong>2006</strong>.<br />
GPM*<br />
in %<br />
It needs to be mentioned that the 2005 contribution<br />
margin (gross profit) for the region Europe / Africa /<br />
Middle East / CIS was negatively impacted by the<br />
effect of the onetime incident in the air freight<br />
division of <strong>Panalpina</strong> Airfreight Management Ltd.<br />
of CHF 22.4 million.<br />
The substantial increase of the contribution margin<br />
(gross profit) in this region in <strong>2006</strong> can be ex<br />
plained by different factors: on the one hand, the<br />
further development and expansion of the oil<br />
and gas sector from existing customers out of the<br />
traditional African oil and gas countries, but also<br />
from emerging energy producing geographical<br />
areas like Central Asia (Kazakhstan, Azerbaijan<br />
a.s.f.). On the other hand, the constantly increasing<br />
demand for goods produced in Asia, either from<br />
European or, more and more, upcoming Asian companies,<br />
is the reason for the volume growth into<br />
Europe. Not to forget the full year impact of the<br />
acquisitions realized in 2005 in Norway accounting<br />
for 1.2% of the contribution margin (gross profit)<br />
increase of this region. At the same time, the Group<br />
was awarded various additional multinational<br />
accounts in the telecom industry that contributed<br />
to the achieved increase.<br />
The North American region continued on the<br />
growth path it engaged on during 2005 to the difference<br />
that the margin erosion stopped and<br />
even reversed slightly to end the year with positive<br />
results. Important contributors to these gains are<br />
multinational accounts in the different industry<br />
verticals but mainly in the oil and gas sector as<br />
well as the mining sector.<br />
Central and South America could record a considerable<br />
contribution margin (gross profit) level<br />
thanks to project business in the mining sector as<br />
well as the positive development of Asian imports.<br />
The Asia / Pacific region solely experienced a gross<br />
profit margin reduction mainly resulting from the<br />
increasing air freight rates that were most significant<br />
in the fourth quarter, where capacity traded<br />
at high levels because of high demand. Fierce<br />
competition which forced price reductions to customers<br />
and some modal shifts on the Asia – Europe –<br />
Asia trade lane affected the margin as well.<br />
∆ per year<br />
in %<br />
share<br />
in %<br />
Full year<br />
2005<br />
Europe /Africa / Middle East / CIS 916 20.7 14.4 57.6 801 20.3 56.9<br />
North America 307 18.1 12.5 19.3 273 17.8 19.4<br />
Central and South America 137 20.4 14.2 8.6 120 18.1 8.5<br />
Asia / Pacific 231 24.4 7.9 14.5 214 26.1 15.2<br />
GPM*<br />
in %<br />
Total 1,5 1 20.6 1 .0 100.0 1,408 20.2 100.0<br />
* GPM: gross profit margin (gross profit in percent of net forwarding revenues)<br />
share<br />
in %
![Eigenes Luftfrachtnetzwerk [pdf | 244 KB] - Panalpina](https://img.yumpu.com/23347328/1/184x260/eigenes-luftfrachtnetzwerk-pdf-244-kb-panalpina.jpg?quality=85)
![Übersicht Panalpina [pdf | 240 KB]](https://img.yumpu.com/22547731/1/184x260/ubersicht-panalpina-pdf-240-kb.jpg?quality=85)
![Seefracht [pdf | 181 KB] - Panalpina](https://img.yumpu.com/22234724/1/184x260/seefracht-pdf-181-kb-panalpina.jpg?quality=85)


![Annual Report 2012 [pdf | 1 MB] - Panalpina](https://img.yumpu.com/15342099/1/184x260/annual-report-2012-pdf-1-mb-panalpina.jpg?quality=85)