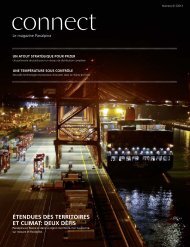
Panalpina Annual Report 2006
Panalpina Annual Report 2006
Panalpina Annual Report 2006

Create successful ePaper yourself
Turn your PDF publications into a flip-book with our unique Google optimized e-Paper software.
Consolidated and <strong>Annual</strong> Financial Statements <strong>2006</strong><br />
5<br />
88 <strong>Panalpina</strong> <strong>Annual</strong> <strong>Report</strong> <strong>2006</strong><br />
Segmental reporting<br />
<strong>Report</strong>ing by geographical segments<br />
Europe / Africa /<br />
Central and South<br />
Middle East / CIS North America<br />
America<br />
in million CHF <strong>2006</strong> 2005 <strong>2006</strong> 2005 <strong>2006</strong> 2005<br />
External forwarding services 4,418 3,929 1,699 1,536 670 662<br />
Intra-group forwarding services 2,585 2,407 492 455 184 130<br />
Net forwarding revenue 7,003 6,336 2,191 1,991 854 792<br />
Forwarding services from third parties (6,087) (5,535) (1,884) (1,718) (717) (672)<br />
Segment contribution margin (gross profit) 916 801 307 273 137 120<br />
Other segment expenses (753) (719) (296) (270) (118) (109)<br />
Segment operating result (Ebit) 163 82 11 3 19 11<br />
Financial result<br />
Earnings before taxes<br />
Taxes on income<br />
Consolidated net earnings<br />
Europe / Africa /<br />
Central and South<br />
Middle East / CIS North America<br />
America<br />
in million CHF <strong>2006</strong> 2005 <strong>2006</strong> 2005 <strong>2006</strong> 2005<br />
Additional information<br />
Segment assets 1,328 1,084 322 339 140 123<br />
Segment liabilities 702 602 152 144 48 40<br />
Capital expenditure 35 37 9 (10) 5 3<br />
Depreciation of property, plant and equipment 22 24 6 6 2 2<br />
Amortization of intangible assets 10 8 1 1 1 1<br />
Impairment of financial assets 0 0 0 0 0 0<br />
The Group organizes its business primarily by regions. Segment information is prepared on the basis of the location<br />
of the assets. Usually, the location of the customers does not differ from the location of the assets in the particular region.<br />
Intersegmental services are charged at market rates. Segment expenses are shown after elimination of intra-group<br />
transactions.<br />
<strong>Report</strong>ing by business segments<br />
Air freight<br />
Ocean freight<br />
Supply Chain<br />
Management<br />
in million CHF <strong>2006</strong> 2005 <strong>2006</strong> 2005 <strong>2006</strong> 2005<br />
Net forwarding revenue 3,713 3,408 2,826 2,399 1,196 1,142<br />
Forwarding services from third parties (3,026) (2,772) (2,334) (1,996) (784) (773)<br />
Segment contribution margin 687 636 492 403 412 369<br />
Total assets 838 788 510 536 210 262<br />
Capital expenditure 20 13 11 11 8 17<br />
The Group’s business can be divided into three divisions: Air Freight, Ocean Freight and Supply Chain Management. The<br />
assets allocated to the divisions mainly comprise trade receivables, work in progress, accruals, tangible fixed assets and<br />
intangible assets. Cash, financial investments and assets related to the central management functions are not allocated.
![Eigenes Luftfrachtnetzwerk [pdf | 244 KB] - Panalpina](https://img.yumpu.com/23347328/1/184x260/eigenes-luftfrachtnetzwerk-pdf-244-kb-panalpina.jpg?quality=85)
![Übersicht Panalpina [pdf | 240 KB]](https://img.yumpu.com/22547731/1/184x260/ubersicht-panalpina-pdf-240-kb.jpg?quality=85)
![Seefracht [pdf | 181 KB] - Panalpina](https://img.yumpu.com/22234724/1/184x260/seefracht-pdf-181-kb-panalpina.jpg?quality=85)


![Annual Report 2012 [pdf | 1 MB] - Panalpina](https://img.yumpu.com/15342099/1/184x260/annual-report-2012-pdf-1-mb-panalpina.jpg?quality=85)