Transmission Expansion Planning in Deregulated Power ... - tuprints
Transmission Expansion Planning in Deregulated Power ... - tuprints
Transmission Expansion Planning in Deregulated Power ... - tuprints

You also want an ePaper? Increase the reach of your titles
YUMPU automatically turns print PDFs into web optimized ePapers that Google loves.
3 Probabilistic locational Marg<strong>in</strong>al Prices 28<br />
LMP of bus No. 1 <strong>in</strong> $/MWhr<br />
35<br />
30<br />
25<br />
20<br />
15<br />
10<br />
5<br />
0<br />
0 500 1000<br />
Monte Carlo iteration<br />
1500 2000<br />
0<br />
0 500 1000<br />
Monte Carlo iteration<br />
1500 2000<br />
(a)<br />
(b)<br />
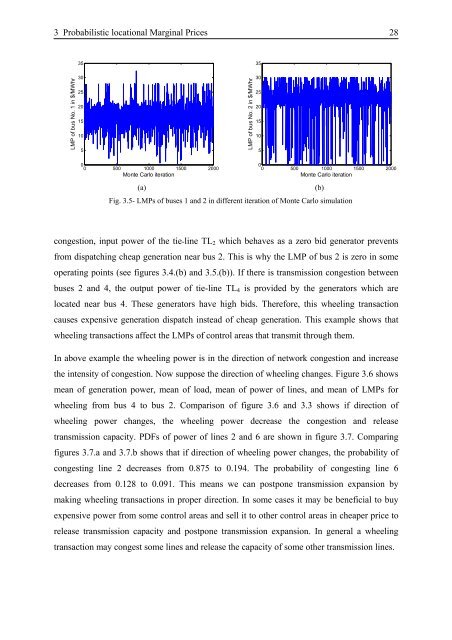
Fig. 3.5- LMPs of buses 1 and 2 <strong>in</strong> different iteration of Monte Carlo simulation<br />
congestion, <strong>in</strong>put power of the tie-l<strong>in</strong>e TL2 which behaves as a zero bid generator prevents<br />
from dispatch<strong>in</strong>g cheap generation near bus 2. This is why the LMP of bus 2 is zero <strong>in</strong> some<br />
operat<strong>in</strong>g po<strong>in</strong>ts (see figures 3.4.(b) and 3.5.(b)). If there is transmission congestion between<br />
buses 2 and 4, the output power of tie-l<strong>in</strong>e TL4 is provided by the generators which are<br />
located near bus 4. These generators have high bids. Therefore, this wheel<strong>in</strong>g transaction<br />
causes expensive generation dispatch <strong>in</strong>stead of cheap generation. This example shows that<br />
wheel<strong>in</strong>g transactions affect the LMPs of control areas that transmit through them.<br />
In above example the wheel<strong>in</strong>g power is <strong>in</strong> the direction of network congestion and <strong>in</strong>crease<br />
the <strong>in</strong>tensity of congestion. Now suppose the direction of wheel<strong>in</strong>g changes. Figure 3.6 shows<br />
mean of generation power, mean of load, mean of power of l<strong>in</strong>es, and mean of LMPs for<br />
wheel<strong>in</strong>g from bus 4 to bus 2. Comparison of figure 3.6 and 3.3 shows if direction of<br />
wheel<strong>in</strong>g power changes, the wheel<strong>in</strong>g power decrease the congestion and release<br />
transmission capacity. PDFs of power of l<strong>in</strong>es 2 and 6 are shown <strong>in</strong> figure 3.7. Compar<strong>in</strong>g<br />
figures 3.7.a and 3.7.b shows that if direction of wheel<strong>in</strong>g power changes, the probability of<br />
congest<strong>in</strong>g l<strong>in</strong>e 2 decreases from 0.875 to 0.194. The probability of congest<strong>in</strong>g l<strong>in</strong>e 6<br />
decreases from 0.128 to 0.091. This means we can postpone transmission expansion by<br />
mak<strong>in</strong>g wheel<strong>in</strong>g transactions <strong>in</strong> proper direction. In some cases it may be beneficial to buy<br />
expensive power from some control areas and sell it to other control areas <strong>in</strong> cheaper price to<br />
release transmission capacity and postpone transmission expansion. In general a wheel<strong>in</strong>g<br />
transaction may congest some l<strong>in</strong>es and release the capacity of some other transmission l<strong>in</strong>es.<br />
LMP of bus No. 2 <strong>in</strong> $/MWhr<br />
35<br />
30<br />
25<br />
20<br />
15<br />
10<br />
5