

Conference, Proceedings
Conference, Proceedings
Conference, Proceedings

Create successful ePaper yourself
Turn your PDF publications into a flip-book with our unique Google optimized e-Paper software.
mixture by short mixing, the mixture put into the forms, evacuated for one hour and<br />
autoclaved.<br />
Before the measurements, all specimens were dried in an oven at 110°C. In the experiments,<br />
four various sample pre‐treatment conditions were tested: reference specimen not exposed to<br />
any load (denoted as T‐ref in what follows), specimen exposed to a gradual temperature<br />
increase up to 600, 800 and 1000°C during two hours, then left for another 2 hours at the final<br />
temperature and slowly cooled (denoted as T‐600, T‐800 and T‐1000 according to the loading<br />
temperature).<br />
Experimental Methods<br />
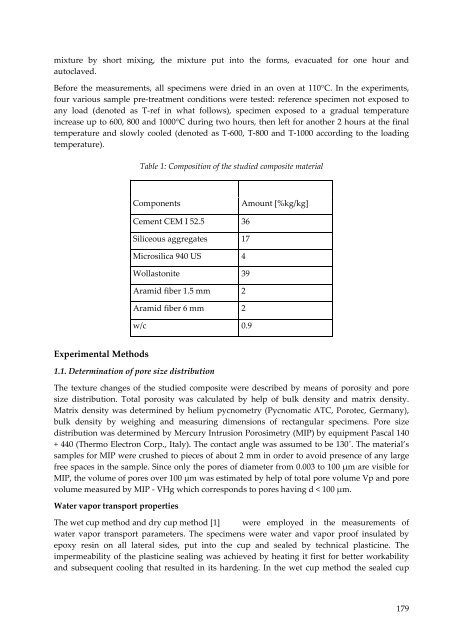
Table 1: Composition of the studied composite material<br />
Components Amount [%kg/kg]<br />
Cement CEM I 52.5 36<br />
Siliceous aggregates 17<br />
Microsilica 940 US 4<br />
Wollastonite 39<br />
Aramid fiber 1.5 mm 2<br />
Aramid fiber 6 mm 2<br />
w/c 0.9<br />
1.1. Determination of pore size distribution<br />
The texture changes of the studied composite were described by means of porosity and pore<br />
size distribution. Total porosity was calculated by help of bulk density and matrix density.<br />
Matrix density was determined by helium pycnometry (Pycnomatic ATC, Porotec, Germany),<br />
bulk density by weighing and measuring dimensions of rectangular specimens. Pore size<br />
distribution was determined by Mercury Intrusion Porosimetry (MIP) by equipment Pascal 140<br />
+ 440 (Thermo Electron Corp., Italy). The contact angle was assumed to be 130˚. The material’s<br />
samples for MIP were crushed to pieces of about 2 mm in order to avoid presence of any large<br />
free spaces in the sample. Since only the pores of diameter from 0.003 to 100 μm are visible for<br />
MIP, the volume of pores over 100 μm was estimated by help of total pore volume Vp and pore<br />
volume measured by MIP ‐ VHg which corresponds to pores having d < 100 μm.<br />
Water vapor transport properties<br />
The wet cup method and dry cup method [1] were employed in the measurements of<br />
water vapor transport parameters. The specimens were water and vapor proof insulated by<br />
epoxy resin on all lateral sides, put into the cup and sealed by technical plasticine. The<br />
impermeability of the plasticine sealing was achieved by heating it first for better workability<br />
and subsequent cooling that resulted in its hardening. In the wet cup method the sealed cup<br />
179


