Conference, Proceedings
Conference, Proceedings
Conference, Proceedings
You also want an ePaper? Increase the reach of your titles
YUMPU automatically turns print PDFs into web optimized ePapers that Google loves.
dessicators are decreased by the perforated plates, the specimens were considered as the infinite<br />
plates and the sorption process could be solved as 1D problem with use of solution (7).<br />
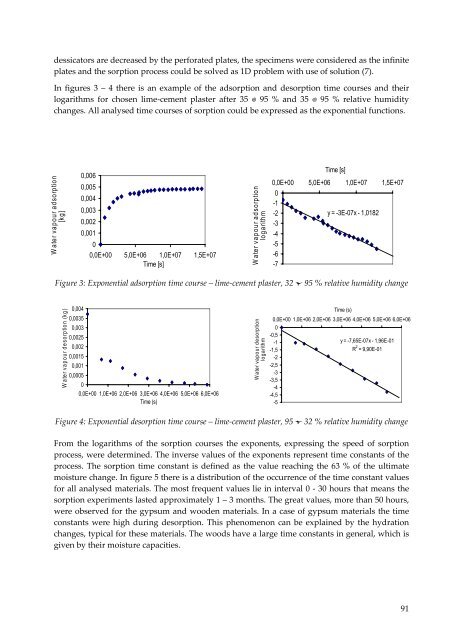
In figures 3 – 4 there is an example of the adsorption and desorption time courses and their<br />
logarithms for chosen lime‐cement plaster after 35 95 % and 35 95 % relative humidity<br />
changes. All analysed time courses of sorption could be expressed as the exponential functions.<br />
Water vapour adsorption<br />
[kg]<br />
Figure 3: Exponential adsorption time course – lime‐cement plaster, 32 95 % relative humidity change<br />
Water vap our desorp tio n (k g)<br />
0,004<br />
0,0035<br />
0,003<br />
0,0025<br />
0,002<br />
0,0015<br />
0,001<br />
0,0005<br />
0,006<br />
0,005<br />
0,004<br />
0,003<br />
0,002<br />
0,001<br />
0<br />
0,0E+00 5,0E+06 1,0E+07 1,5E+07<br />
Time [s]<br />
0<br />
0,0E+00 1,0E+06 2,0E+06 3,0E+06 4,0E+06 5,0E+06 6,0E+06<br />
Time (s)<br />
Water vapour desorption<br />
logarithm<br />
0,0E+00<br />
0<br />
-1<br />
5,0E+06 1,0E+07 1,5E+07<br />
-2<br />
-3<br />
-4<br />
-5<br />
-6<br />
-7<br />
y = -3E-07x - 1,0182<br />
0,0E+00 1,0E+06 2,0E+06 3,0E+06 4,0E+06 5,0E+06 6,0E+06<br />
0<br />
-0,5<br />
-1<br />
-1,5<br />
-2<br />
-2,5<br />
-3<br />
-3,5<br />
-4<br />
-4,5<br />
-5<br />
Time (s)<br />
y = -7,65E-07x - 1,96E-01<br />
R 2 = 9,90E-01<br />
Figure 4: Exponential desorption time course – lime‐cement plaster, 95 32 % relative humidity change<br />
From the logarithms of the sorption courses the exponents, expressing the speed of sorption<br />
process, were determined. The inverse values of the exponents represent time constants of the<br />
process. The sorption time constant is defined as the value reaching the 63 % of the ultimate<br />
moisture change. In figure 5 there is a distribution of the occurrence of the time constant values<br />
for all analysed materials. The most frequent values lie in interval 0 ‐ 30 hours that means the<br />
sorption experiments lasted approximately 1 – 3 months. The great values, more than 50 hours,<br />
were observed for the gypsum and wooden materials. In a case of gypsum materials the time<br />
constants were high during desorption. This phenomenon can be explained by the hydration<br />
changes, typical for these materials. The woods have a large time constants in general, which is<br />
given by their moisture capacities.<br />
Water vapour adsorption<br />
logarithm<br />
Time [s]<br />
91


