Services Innovation in Ireland - Options for ... - Europe INNOVA
Services Innovation in Ireland - Options for ... - Europe INNOVA
Services Innovation in Ireland - Options for ... - Europe INNOVA

You also want an ePaper? Increase the reach of your titles
YUMPU automatically turns print PDFs into web optimized ePapers that Google loves.
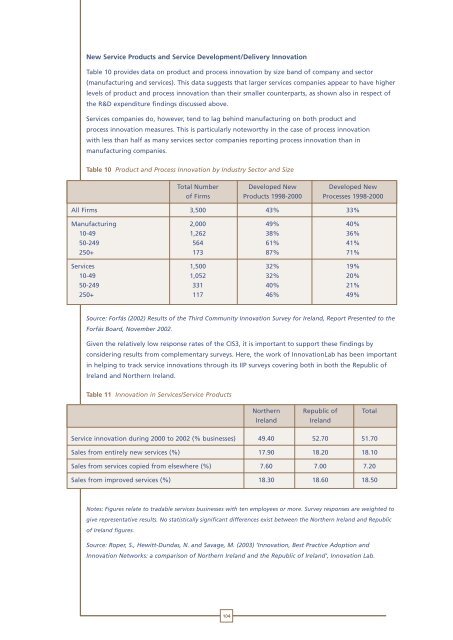
New Service Products and Service Development/Delivery <strong>Innovation</strong><br />
Table 10 provides data on product and process <strong>in</strong>novation by size band of company and sector<br />
(manufactur<strong>in</strong>g and services). This data suggests that larger services companies appear to have higher<br />
levels of product and process <strong>in</strong>novation than their smaller counterparts, as shown also <strong>in</strong> respect of<br />
the R&D expenditure f<strong>in</strong>d<strong>in</strong>gs discussed above.<br />
<strong>Services</strong> companies do, however, tend to lag beh<strong>in</strong>d manufactur<strong>in</strong>g on both product and<br />
process <strong>in</strong>novation measures. This is particularly noteworthy <strong>in</strong> the case of process <strong>in</strong>novation<br />
with less than half as many services sector companies report<strong>in</strong>g process <strong>in</strong>novation than <strong>in</strong><br />
manufactur<strong>in</strong>g companies.<br />
Table 10 Product and Process <strong>Innovation</strong> by Industry Sector and Size<br />
Source: Forfás (2002) Results of the Third Community <strong>Innovation</strong> Survey <strong>for</strong> <strong>Ireland</strong>, Report Presented to the<br />
Forfás Board, November 2002.<br />
Given the relatively low response rates of the CIS3, it is important to support these f<strong>in</strong>d<strong>in</strong>gs by<br />
consider<strong>in</strong>g results from complementary surveys. Here, the work of <strong>Innovation</strong>Lab has been important<br />
<strong>in</strong> help<strong>in</strong>g to track service <strong>in</strong>novations through its IIP surveys cover<strong>in</strong>g both <strong>in</strong> both the Republic of<br />
<strong>Ireland</strong> and Northern <strong>Ireland</strong>.<br />
Table 11 <strong>Innovation</strong> <strong>in</strong> <strong>Services</strong>/Service Products<br />
Notes: Figures relate to tradable services bus<strong>in</strong>esses with ten employees or more. Survey responses are weighted to<br />
give representative results. No statistically significant differences exist between the Northern <strong>Ireland</strong> and Republic<br />
of <strong>Ireland</strong> figures.<br />
Total Number Developed New Developed New<br />
of Firms Products 1998-2000 Processes 1998-2000<br />
All Firms 3,500 43% 33%<br />
Manufactur<strong>in</strong>g 2,000 49% 40%<br />
10-49 1,262 38% 36%<br />
50-249 564 61% 41%<br />
250+ 173 87% 71%<br />
<strong>Services</strong> 1,500 32% 19%<br />
10-49 1,052 32% 20%<br />
50-249 331 40% 21%<br />
250+ 117 46% 49%<br />
Source: Roper, S., Hewitt-Dundas, N. and Savage, M. (2003) ‘<strong>Innovation</strong>, Best Practice Adoption and<br />
<strong>Innovation</strong> Networks: a comparison of Northern <strong>Ireland</strong> and the Republic of <strong>Ireland</strong>’, <strong>Innovation</strong> Lab.<br />
104<br />
Northern Republic of Total<br />
<strong>Ireland</strong> <strong>Ireland</strong><br />
Service <strong>in</strong>novation dur<strong>in</strong>g 2000 to 2002 (% bus<strong>in</strong>esses) 49.40 52.70 51.70<br />
Sales from entirely new services (%) 17.90 18.20 18.10<br />
Sales from services copied from elsewhere (%) 7.60 7.00 7.20<br />
Sales from improved services (%) 18.30 18.60 18.50