download pdf version of PhD book - Universiteit Utrecht
download pdf version of PhD book - Universiteit Utrecht
download pdf version of PhD book - Universiteit Utrecht

You also want an ePaper? Increase the reach of your titles
YUMPU automatically turns print PDFs into web optimized ePapers that Google loves.
6. Dispersivity under Partially-Saturated Conditions<br />
. . . . . . . . . . . . . . . . . . . . . . . . . . . . . . . . . . . . . . . . . . . . . . . . . . . . . . . . . . . . . . . . . . . . . . . . . . . . .<br />
∆t ≤ min {T ij , T ij,k , T CU,i , T i } (6.17)<br />
where T α denotes the residence time pertaining to the elements α within the<br />
pore network.<br />
After obtaining the solution for concnetrations, at any given time, BTCs at<br />
a given longitudinal position were found by averaging the concentrations <strong>of</strong><br />
pores that possess the same longitudinal coordinate. In calculating BTCs,<br />
the concentrations <strong>of</strong> pore bodies were weighted by their volumetric flow rate;<br />
resulting in a flux-averaged concentration. That is, the normalized average<br />
concentration, c(x, t), is given by<br />
c(x, t) =<br />
[ ∑N x<br />
t<br />
i<br />
∑ N x<br />
t<br />
]<br />
c i (x, t)Q i<br />
i Q i<br />
1<br />
c 0<br />
i = 1, 2, 3, . . . , N t (6.18)<br />
where c 0 is inlet solute concentration, and Nt<br />
x denotes the total number <strong>of</strong><br />
pore body elements that are centered at the longitudinal coordinate x. The<br />
longitudinal coordinate could be written as multiples an interval <strong>of</strong> an l, i.e.<br />
x = 1l, 2l, . . . , L. where l is the horizontal distance between centers <strong>of</strong> two<br />
adjacent pore bodies. The breakthrough curve at the outlet is obtained by<br />
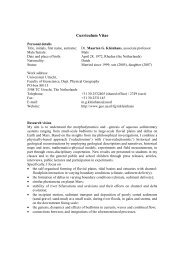
plotting c(x = L, t). Figure (6.5) shows an example BTC at the outlet <strong>of</strong><br />
the network. We use these results to calculate (macroscopic) dispersivity as<br />
described in the next section.<br />
Figure 6.5: Example <strong>of</strong> resulting breakthrough curve <strong>of</strong> average concentration<br />
computed from the network (shown by symbols). The solid line is the solution<br />
<strong>of</strong> 1D advection-dispersion equation.<br />
144