- Page 1 and 2:
Reactive/Adsorptive Transport in (P
- Page 3:
text Reactive/Adsorptive Transport
- Page 6 and 7:
Promoter: Prof.dr.ir. S.M. Hassaniz
- Page 8 and 9:
My colleagues and other staff in th
- Page 10 and 11:
CONTENTS 2.2.3 Connection Matrix .
- Page 12 and 13:
CONTENTS 5.3.3 Regular hyperbolic p
- Page 14 and 15:
CONTENTS 8.3.1 Non-adsorptive solut
- Page 16 and 17:
LIST OF FIGURES 3.6 The relation be
- Page 18 and 19:
LIST OF FIGURES 6.5 Breakthrough cu
- Page 20 and 21:
LIST OF TABLES 2.1 Expressions for
- Page 22 and 23:
1. Introduction . . . . . . . . . .
- Page 24 and 25:
1. Introduction . . . . . . . . . .
- Page 26 and 27:
1. Introduction . . . . . . . . . .
- Page 28 and 29:
1. Introduction . . . . . . . . . .
- Page 30 and 31:
1. Introduction . . . . . . . . . .
- Page 32 and 33:
1. Introduction . . . . . . . . . .
- Page 34 and 35:
1. Introduction . . . . . . . . . .
- Page 37:
Part I Generation of Multi-Directio
- Page 40 and 41:
2. Generating MultiDirectional Pore
- Page 42 and 43:
2. Generating MultiDirectional Pore
- Page 44 and 45:
2. Generating MultiDirectional Pore
- Page 46 and 47:
2. Generating MultiDirectional Pore
- Page 48 and 49:
2. Generating MultiDirectional Pore
- Page 50 and 51:
2. Generating MultiDirectional Pore
- Page 52 and 53:
2. Generating MultiDirectional Pore
- Page 54 and 55:
2. Generating MultiDirectional Pore
- Page 56 and 57:
2. Generating MultiDirectional Pore
- Page 58 and 59:
2. Generating MultiDirectional Pore
- Page 61 and 62:
Published as: Raoof, A. and Hassani
- Page 63 and 64:
3.1 Introduction . . . . . . . . .
- Page 65 and 66:
3.1 Introduction . . . . . . . . .
- Page 67 and 68:
3.2 Theoretical upscaling of adsorp
- Page 69 and 70:
3.2 Theoretical upscaling of adsorp
- Page 71 and 72:
3.2 Theoretical upscaling of adsorp
- Page 73 and 74:
3.3 Numerical upscaling of adsorbin
- Page 75 and 76:
3.3 Numerical upscaling of adsorbin
- Page 77 and 78:
3.3 Numerical upscaling of adsorbin
- Page 79 and 80:
3.3 Numerical upscaling of adsorbin
- Page 81 and 82:
3.4 Discussion of results . . . . .
- Page 83 and 84:
3.5 Conclusion . . . . . . . . . .
- Page 85 and 86:
Published as: Raoof, A. and Hassani
- Page 87 and 88:
4.1 Introduction . . . . . . . . .
- Page 89 and 90:
4.1 Introduction . . . . . . . . .
- Page 91 and 92:
4.2 Description of the Pore-Network
- Page 93 and 94:
4.3 Simulating flow and transport w
- Page 95 and 96:
4.3 Simulating flow and transport w
- Page 97 and 98:
4.4 Macro-scale adsorption coeffici
- Page 99 and 100:
4.4 Macro-scale adsorption coeffici
- Page 101 and 102:
4.4 Macro-scale adsorption coeffici
- Page 103 and 104:
4.5 Discussion . . . . . . . . . .
- Page 105 and 106:
4.5 Discussion . . . . . . . . . .
- Page 107:
4.6 Conclusions . . . . . . . . . .
- Page 111 and 112:
Raoof, A. and Hassanizadeh S. M.,
- Page 113 and 114:
5.1 Introduction . . . . . . . . .
- Page 115 and 116:
5.1 Introduction . . . . . . . . .
- Page 117 and 118:
5.2 Network Generation . . . . . .
- Page 119 and 120:
5.2 Network Generation . . . . . .
- Page 121 and 122:
5.3 Modeling flow in the network .
- Page 123 and 124:
5.3 Modeling flow in the network .
- Page 125 and 126:
5.3 Modeling flow in the network .
- Page 127 and 128:
5.3 Modeling flow in the network .
- Page 129 and 130:
5.3 Modeling flow in the network .
- Page 131 and 132:
5.4 Results . . . . . . . . . . . .
- Page 133 and 134:
5.4 Results . . . . . . . . . . . .
- Page 135 and 136:
5.4 Results . . . . . . . . . . . .
- Page 137 and 138:
5.4 Results . . . . . . . . . . . .
- Page 139 and 140:
5.4 Results . . . . . . . . . . . .
- Page 141 and 142:
5.4 Results . . . . . . . . . . . .
- Page 143: 5.5 Conclusion Our approach is also
- Page 146 and 147: 6. Dispersivity under Partially-Sat
- Page 148 and 149: 6. Dispersivity under Partially-Sat
- Page 150 and 151: 6. Dispersivity under Partially-Sat
- Page 152 and 153: 6. Dispersivity under Partially-Sat
- Page 154 and 155: 6. Dispersivity under Partially-Sat
- Page 156 and 157: 6. Dispersivity under Partially-Sat
- Page 158 and 159: 6. Dispersivity under Partially-Sat
- Page 160 and 161: 6. Dispersivity under Partially-Sat
- Page 162 and 163: 6. Dispersivity under Partially-Sat
- Page 164 and 165: 6. Dispersivity under Partially-Sat
- Page 166 and 167: 6. Dispersivity under Partially-Sat
- Page 168 and 169: 6. Dispersivity under Partially-Sat
- Page 170 and 171: 6. Dispersivity under Partially-Sat
- Page 172 and 173: 6. Dispersivity under Partially-Sat
- Page 174 and 175: 6. Dispersivity under Partially-Sat
- Page 176 and 177: 6. Dispersivity under Partially-Sat
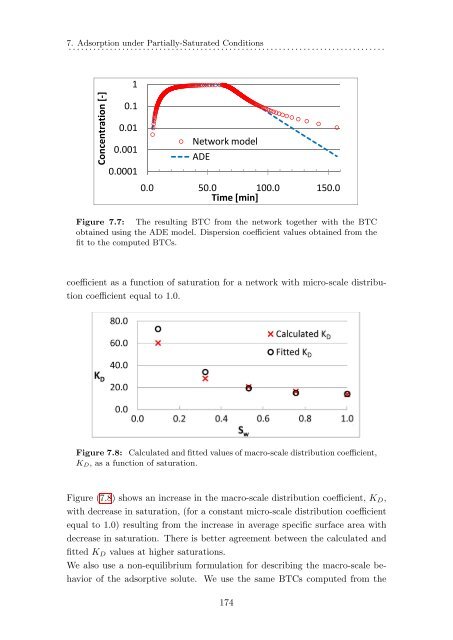
- Page 178 and 179: 7. Adsorption under Partially-Satur
- Page 180 and 181: 7. Adsorption under Partially-Satur
- Page 182 and 183: 7. Adsorption under Partially-Satur
- Page 184 and 185: 7. Adsorption under Partially-Satur
- Page 186 and 187: 7. Adsorption under Partially-Satur
- Page 188 and 189: 7. Adsorption under Partially-Satur
- Page 190 and 191: 7. Adsorption under Partially-Satur
- Page 192 and 193: 7. Adsorption under Partially-Satur
- Page 196 and 197: 7. Adsorption under Partially-Satur
- Page 198 and 199: 8. Numerical scheme . . . . . . . .
- Page 200 and 201: 8. Numerical scheme . . . . . . . .
- Page 202 and 203: 8. Numerical scheme . . . . . . . .
- Page 204 and 205: 8. Numerical scheme . . . . . . . .
- Page 206 and 207: 8. Numerical scheme . . . . . . . .
- Page 208 and 209: 8. Numerical scheme . . . . . . . .
- Page 210 and 211: 8. Numerical scheme . . . . . . . .
- Page 212 and 213: 8. Numerical scheme . . . . . . . .
- Page 214 and 215: 8. Numerical scheme substituting fo
- Page 216 and 217: 9. Summary and Conclusions . . . .
- Page 218 and 219: 9. Summary and Conclusions . . . .
- Page 220 and 221: 9. Summary and Conclusions . . . .
- Page 222 and 223: Appendix A . . . . . . . . . . . .
- Page 224 and 225: Appendix A . . . . . . . . . . . .
- Page 226 and 227: Appendix B . . . . . . . . . . . .
- Page 228 and 229: Appendix C average velocity: ṽ =
- Page 230 and 231: REFERENCES . . . . . . . . . . . .
- Page 232 and 233: REFERENCES . . . . . . . . . . . .
- Page 234 and 235: REFERENCES . . . . . . . . . . . .
- Page 236 and 237: REFERENCES . . . . . . . . . . . .
- Page 238 and 239: REFERENCES . . . . . . . . . . . .
- Page 240 and 241: REFERENCES . . . . . . . . . . . .
- Page 242 and 243: REFERENCES . . . . . . . . . . . .
- Page 244 and 245:
REFERENCES . . . . . . . . . . . .
- Page 246 and 247:
REFERENCES . . . . . . . . . . . .
- Page 248 and 249:
REFERENCES . . . . . . . . . . . .
- Page 250 and 251:
REFERENCES . . . . . . . . . . . .
- Page 252 and 253:
REFERENCES . . . . . . . . . . . .
- Page 254 and 255:
REFERENCES . . . . . . . . . . . .
- Page 256 and 257:
REFERENCES D.F. Yule and W.R. Gardn
- Page 258:
و ه د ر ش ل ات