Laboratory Manual - King Fahd University of Petroleum and Minerals
Laboratory Manual - King Fahd University of Petroleum and Minerals
Laboratory Manual - King Fahd University of Petroleum and Minerals

Create successful ePaper yourself
Turn your PDF publications into a flip-book with our unique Google optimized e-Paper software.
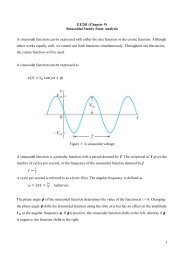
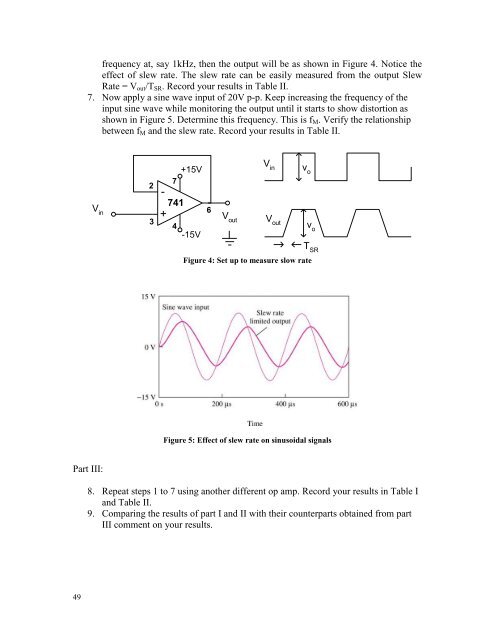
frequency at, say 1kHz, then the output will be as shown in Figure 4. Notice the<br />
effect <strong>of</strong> slew rate. The slew rate can be easily measured from the output Slew<br />
Rate = V out /T SR . Record your results in Table II.<br />
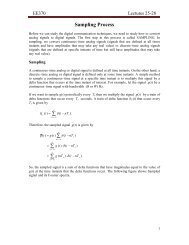
7. Now apply a sine wave input <strong>of</strong> 20V p-p. Keep increasing the frequency <strong>of</strong> the<br />
input sine wave while monitoring the output until it starts to show distortion as<br />
shown in Figure 5. Determine this frequency. This is f M . Verify the relationship<br />
between f M <strong>and</strong> the slew rate. Record your results in Table II.<br />
V in<br />
2<br />
3<br />
7<br />
-<br />
741<br />
+<br />
+15V<br />
4<br />
-15V<br />
6<br />
V out<br />
V in<br />
V out<br />
v o<br />
v o<br />
T SR<br />
Figure 4: Set up to measure slow rate<br />
Figure 5: Effect <strong>of</strong> slew rate on sinusoidal signals<br />
Part III:<br />
8. Repeat steps 1 to 7 using another different op amp. Record your results in Table I<br />
<strong>and</strong> Table II.<br />
9. Comparing the results <strong>of</strong> part I <strong>and</strong> II with their counterparts obtained from part<br />
III comment on your results.<br />
49