
You also want an ePaper? Increase the reach of your titles
YUMPU automatically turns print PDFs into web optimized ePapers that Google loves.
% <strong>of</strong> clasts<br />
40<br />
35<br />
30<br />
25<br />
20<br />
15<br />
10<br />
Type 1<br />
0.1-1cm radius clasts<br />
1-10cm radius clasts<br />
10+ radius clasts Total mean<br />
1-<br />
10cm<br />
radius,<br />
431<br />
0.1-<br />
1cm<br />
radius,<br />
925<br />
10+cm<br />
radius,<br />
6<br />
5<br />
% <strong>of</strong> clasts<br />
0<br />
40<br />
35<br />
30<br />
25<br />
20<br />
15<br />
10<br />
5<br />
0<br />
35<br />
30<br />
0 0.2 0.4 0.6 0.8 1<br />
Circularity<br />
Type 2<br />
0 0.2 0.4 0.6 0.8 1<br />
Circularity<br />
40<br />
Type 3<br />
1-10cm<br />
radius,<br />
644<br />
10+cm<br />
radius,<br />
14<br />
1-<br />
10cm<br />
radius,<br />
595<br />
0.1-<br />
1cm<br />
radius,<br />
2155<br />
10+cm<br />
radius,<br />
9<br />
Circularity<br />
1<br />
0.9<br />
0.8<br />
0.7<br />
0.6<br />
0.5<br />
0.4<br />
0.3<br />
0.2<br />
0.1<br />
0<br />
Clast Circularity Analysis<br />
0.1-1cm 1-10cm 10+cm<br />
Type 1 Type 2 Type 3<br />
% <strong>of</strong> clasts<br />
25<br />
20<br />
15<br />
0.1-1cm<br />
radius,<br />
3945<br />
10<br />
5<br />
0<br />
0 0.2 0.4 0.6 0.8 1<br />
Circularity<br />
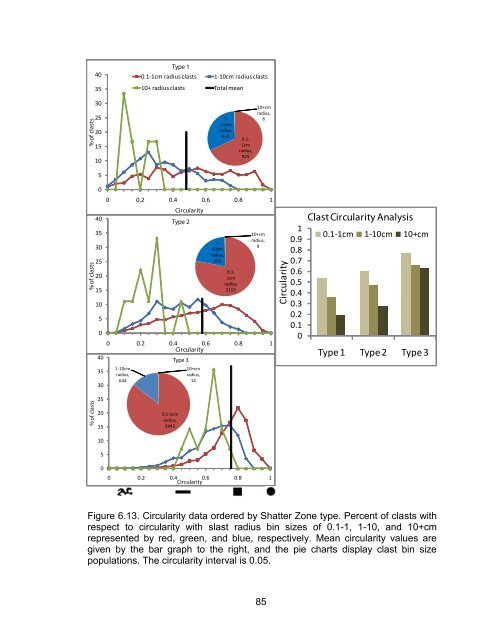
Figure 6.13. Circularity data ordered by Shatter Zone type. Percent <strong>of</strong> clasts with<br />
respect to circularity with slast radius bin sizes <strong>of</strong> 0.1-1, 1-10, and 10+cm<br />
represented by red, green, and blue, respectively. Mean circularity values are<br />
given by the bar graph to the right, and the pie charts display clast bin size<br />
populations. The circularity interval is 0.05.<br />
85