Create successful ePaper yourself
Turn your PDF publications into a flip-book with our unique Google optimized e-Paper software.
A<br />
1000<br />
CSD Type 3 compared to Type 2<br />
Type 2 Bar<br />
Harbor clasts<br />
D = 3.2<br />
count: 5538<br />
R² = 0.9865<br />
Type 3 diorite<br />
clasts<br />
D = 2.63<br />
count: 5391<br />
R² = 0.9891<br />
100<br />
Type 3 Bar Non-fractal<br />
Harbor clasts<br />
count: 284<br />
R² = 0.9915<br />
Cumulate frequency/m^2<br />
10<br />
1<br />
cumulate frequency/m^2<br />
1000<br />
100<br />
10<br />
1<br />
B<br />
D sf<br />
= 1.66<br />
R 2 = 0.9867<br />
Diabase clasts (count=5391)<br />
Bar Harbor clasts (count=284)<br />
D sf<br />
= 4.06<br />
R 2 = 0.9492<br />
D = 2.63<br />
R² = 0.9891<br />
0.1<br />
0.1<br />
0.1 1 10<br />
radius (cm)<br />
0.1 1 10<br />
Clast radius r (cm)<br />
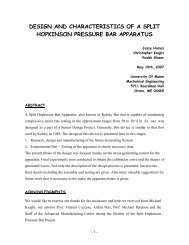
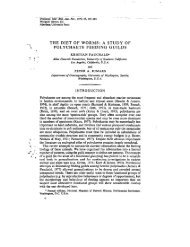
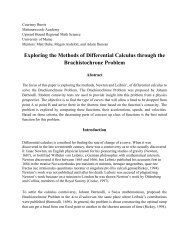
Figure 6.11. Clast size distribution data for Type 3 Shatter Zone. A) Type 3 data<br />
are split by rock type: Bar Harbor Formation (red) and diorite (blue) size<br />
distributions are compared to Type 2 distributions. Type 3 Bar Harbor formation<br />
best fits an exponential (i.e., nonfractal) trend. B) An alternative bifractal<br />
interpretation for Type 3 Bar Harbor Formation size distribution trend.<br />
81