

Disability Services Commission Annual Report
Disability Services Commission Annual Report
Disability Services Commission Annual Report

You also want an ePaper? Increase the reach of your titles
YUMPU automatically turns print PDFs into web optimized ePapers that Google loves.
4.6 Government Policy Requirements<br />
<br />
<br />
Reviewed, assessed and validated all strategic and directorate risks as part of<br />
the <strong>Commission</strong>’s Risk Management Framework.<br />
Conducted an OSH Training Needs Analysis.<br />
OSH Training<br />
<br />
<br />
<br />
<br />
<br />
Planned, developed and implemented OSH training on Hazard and Injury<br />
Management for line managers.<br />
Coordinated awareness programs on Embracing Work-life Balance and<br />
Managers Stressors and Strategies conducted by Employee Assistance<br />
Program.<br />
Coordinated Mental Health First Aid Training.<br />
Presented OSH induction training for new employees and refresher training for<br />
existing employees.<br />
Coordinated five day training course for all the newly elected safety and health<br />
representatives.<br />
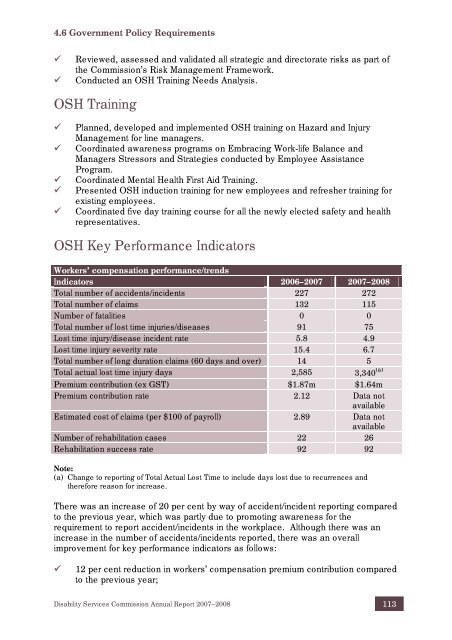
OSH Key Performance Indicators<br />
Workers’ compensation performance/trends<br />
Indicators 2006–2007 2007–2008<br />
Total number of accidents/incidents 227 272<br />
Total number of claims 132 115<br />
Number of fatalities 0 0<br />
Total number of lost time injuries/diseases 91 75<br />
Lost time injury/disease incident rate 5.8 4.9<br />
Lost time injury severity rate 15.4 6.7<br />
Total number of long duration claims (60 days and over) 14 5<br />
Total actual lost time injury days 2,585 3,340 (a)<br />
Premium contribution (ex GST) $1.87m $1.64m<br />
Premium contribution rate 2.12 Data not<br />
available<br />
Estimated cost of claims (per $100 of payroll) 2.89 Data not<br />
available<br />
Number of rehabilitation cases 22 26<br />
Rehabilitation success rate 92 92<br />
Note:<br />
(a) Change to reporting of Total Actual Lost Time to include days lost due to recurrences and<br />
therefore reason for increase.<br />
There was an increase of 20 per cent by way of accident/incident reporting compared<br />
to the previous year, which was partly due to promoting awareness for the<br />
requirement to report accident/incidents in the workplace. Although there was an<br />
increase in the number of accidents/incidents reported, there was an overall<br />
improvement for key performance indicators as follows:<br />
<br />
12 per cent reduction in workers’ compensation premium contribution compared<br />
to the previous year;<br />
<strong>Disability</strong> <strong>Services</strong> <strong>Commission</strong> <strong>Annual</strong> <strong>Report</strong> 2007–2008 113
![Heerarka Adeegyada Naafada [PDF 102 kB] - Disability Services ...](https://img.yumpu.com/22096139/1/184x260/heerarka-adeegyada-naafada-pdf-102-kb-disability-services-.jpg?quality=85)

![معايير خدمات الإعاقة [PDF 297 kB] - Disability Services Commission](https://img.yumpu.com/22096120/1/184x260/-pdf-297-kb-disability-services-commission.jpg?quality=85)