

Disability Services Commission Annual Report
Disability Services Commission Annual Report
Disability Services Commission Annual Report

You also want an ePaper? Increase the reach of your titles
YUMPU automatically turns print PDFs into web optimized ePapers that Google loves.
2.2 Service <strong>Report</strong>s — Individual and Family Support<br />
<br />
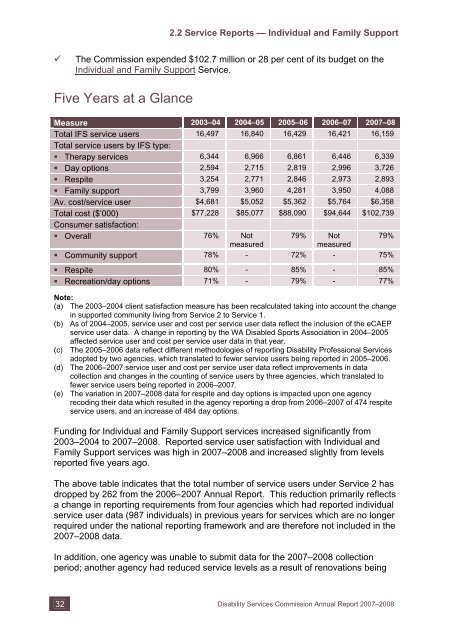
The <strong>Commission</strong> expended $102.7 million or 28 per cent of its budget on the<br />
Individual and Family Support Service.<br />
Five Years at a Glance<br />
Measure 2003–04 2004–05 2005–06 2006–07 2007–08<br />
Total IFS service users 16,497 16,840 16,429 16,421 16,159<br />
Total service users by IFS type:<br />
• Therapy services 6,344 6,966 6,861 6,446 6,339<br />
• Day options 2,594 2,715 2,819 2,996 3,726<br />
• Respite 3,254 2,771 2,846 2,973 2,893<br />
• Family support 3,799 3,960 4,281 3,950 4,088<br />
Av. cost/service user $4,681 $5,052 $5,362 $5,764 $6,358<br />
Total cost ($’000) $77,228 $85,077 $88,090 $94,644 $102,739<br />
Consumer satisfaction:<br />
• Overall 76% Not<br />
79% Not<br />
79%<br />
measured<br />
measured<br />
• Community support 78% - 72% - 75%<br />
• Respite 80% - 85% - 85%<br />
• Recreation/day options 71% - 79% - 77%<br />
Note:<br />
(a) The 2003–2004 client satisfaction measure has been recalculated taking into account the change<br />
in supported community living from Service 2 to Service 1.<br />
(b) As of 2004–2005, service user and cost per service user data reflect the inclusion of the eCAEP<br />
service user data. A change in reporting by the WA Disabled Sports Association in 2004–2005<br />
affected service user and cost per service user data in that year.<br />
(c) The 2005–2006 data reflect different methodologies of reporting <strong>Disability</strong> Professional <strong>Services</strong><br />
adopted by two agencies, which translated to fewer service users being reported in 2005–2006.<br />
(d) The 2006–2007 service user and cost per service user data reflect improvements in data<br />
collection and changes in the counting of service users by three agencies, which translated to<br />
fewer service users being reported in 2006–2007.<br />
(e) The variation in 2007–2008 data for respite and day options is impacted upon one agency<br />
recoding their data which resulted in the agency reporting a drop from 2006–2007 of 474 respite<br />
service users, and an increase of 484 day options.<br />
Funding for Individual and Family Support services increased significantly from<br />
2003–2004 to 2007–2008. <strong>Report</strong>ed service user satisfaction with Individual and<br />
Family Support services was high in 2007–2008 and increased slightly from levels<br />
reported five years ago.<br />
The above table indicates that the total number of service users under Service 2 has<br />
dropped by 262 from the 2006–2007 <strong>Annual</strong> <strong>Report</strong>. This reduction primarily reflects<br />
a change in reporting requirements from four agencies which had reported individual<br />
service user data (987 individuals) in previous years for services which are no longer<br />
required under the national reporting framework and are therefore not included in the<br />
2007–2008 data.<br />
In addition, one agency was unable to submit data for the 2007–2008 collection<br />
period; another agency had reduced service levels as a result of renovations being<br />
32 <strong>Disability</strong> <strong>Services</strong> <strong>Commission</strong> <strong>Annual</strong> <strong>Report</strong> 2007–2008

![Heerarka Adeegyada Naafada [PDF 102 kB] - Disability Services ...](https://img.yumpu.com/22096139/1/184x260/heerarka-adeegyada-naafada-pdf-102-kb-disability-services-.jpg?quality=85)

![معايير خدمات الإعاقة [PDF 297 kB] - Disability Services Commission](https://img.yumpu.com/22096120/1/184x260/-pdf-297-kb-disability-services-commission.jpg?quality=85)