

Disability Services Commission Annual Report
Disability Services Commission Annual Report
Disability Services Commission Annual Report

Create successful ePaper yourself
Turn your PDF publications into a flip-book with our unique Google optimized e-Paper software.
4.2 Performance Indicators<br />
Performance Information<br />
Outcome<br />
Enhance the environment and wellbeing of people with disabilities and their<br />
carers by the provision of necessary supports and services<br />
Effectiveness Indicators<br />
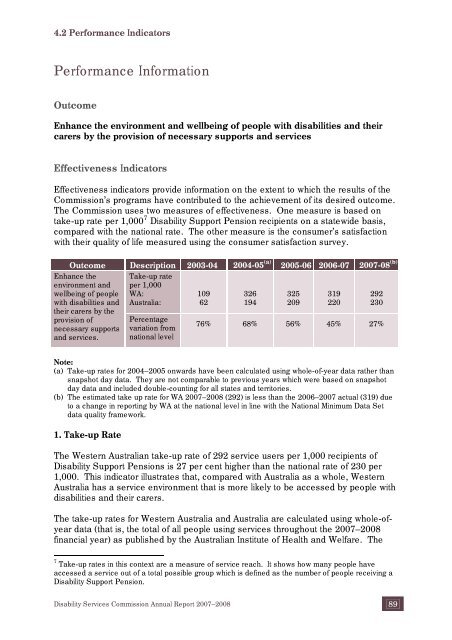
Effectiveness indicators provide information on the extent to which the results of the<br />
<strong>Commission</strong>’s programs have contributed to the achievement of its desired outcome.<br />
The <strong>Commission</strong> uses two measures of effectiveness. One measure is based on<br />
take-up rate per 1,000 7 <strong>Disability</strong> Support Pension recipients on a statewide basis,<br />
compared with the national rate. The other measure is the consumer’s satisfaction<br />
with their quality of life measured using the consumer satisfaction survey.<br />
Outcome Description 2003-04 2004-05 (a) 2005-06 2006-07 2007-08 (b)<br />
Take-up rate<br />
per 1,000<br />
WA:<br />
Australia:<br />
109<br />
62<br />
326<br />
194<br />
325<br />
209<br />
319<br />
220<br />
292<br />
230<br />
Enhance the<br />
environment and<br />
wellbeing of people<br />
with disabilities and<br />
their carers by the<br />
provision of<br />
necessary supports<br />
and services.<br />
Percentage<br />
variation from<br />
national level<br />
76% 68% 56% 45% 27%<br />
Note:<br />
(a) Take-up rates for 2004–2005 onwards have been calculated using whole-of-year data rather than<br />
snapshot day data. They are not comparable to previous years which were based on snapshot<br />
day data and included double-counting for all states and territories.<br />
(b) The estimated take up rate for WA 2007–2008 (292) is less than the 2006–2007 actual (319) due<br />
to a change in reporting by WA at the national level in line with the National Minimum Data Set<br />
data quality framework.<br />
1. Take-up Rate<br />
The Western Australian take-up rate of 292 service users per 1,000 recipients of<br />
<strong>Disability</strong> Support Pensions is 27 per cent higher than the national rate of 230 per<br />
1,000. This indicator illustrates that, compared with Australia as a whole, Western<br />
Australia has a service environment that is more likely to be accessed by people with<br />
disabilities and their carers.<br />
The take-up rates for Western Australia and Australia are calculated using whole-ofyear<br />
data (that is, the total of all people using services throughout the 2007–2008<br />
financial year) as published by the Australian Institute of Health and Welfare. The<br />
7 Take-up rates in this context are a measure of service reach. It shows how many people have<br />
accessed a service out of a total possible group which is defined as the number of people receiving a<br />
<strong>Disability</strong> Support Pension.<br />
<strong>Disability</strong> <strong>Services</strong> <strong>Commission</strong> <strong>Annual</strong> <strong>Report</strong> 2007–2008 89

![Heerarka Adeegyada Naafada [PDF 102 kB] - Disability Services ...](https://img.yumpu.com/22096139/1/184x260/heerarka-adeegyada-naafada-pdf-102-kb-disability-services-.jpg?quality=85)

![معايير خدمات الإعاقة [PDF 297 kB] - Disability Services Commission](https://img.yumpu.com/22096120/1/184x260/-pdf-297-kb-disability-services-commission.jpg?quality=85)