

Disability Services Commission Annual Report
Disability Services Commission Annual Report
Disability Services Commission Annual Report

Create successful ePaper yourself
Turn your PDF publications into a flip-book with our unique Google optimized e-Paper software.
4.2 Performance Indicators<br />
# Service users<br />
4,000<br />
3,500<br />
3,000<br />
2,500<br />
2,000<br />
1,500<br />
1,000<br />
500<br />
0<br />
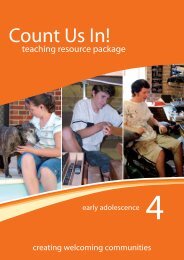
Percentage of budget<br />
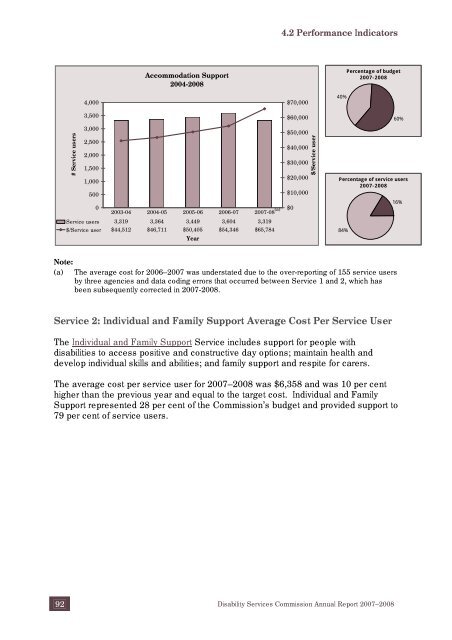
Accommodation Support<br />
2007-2008<br />
2004-2008<br />
40%<br />
$70,000<br />
$60,000<br />
$50,000<br />
$40,000<br />
$30,000<br />
$20,000<br />
$10,000<br />
$0<br />
2003-04 2004-05 2005-06 2006-07 2007-08 (a)<br />
Service users 3,319 3,364 3,449 3,604 3,319<br />
$/Service user $44,512 $46,711 $50,405 $54,346 $65,784<br />
Year<br />
$/Service user<br />
60%<br />
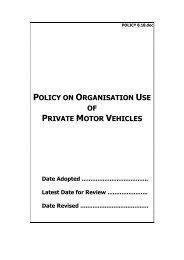
Percentage of service users<br />
2007-2008<br />
84%<br />
16%<br />
Note:<br />
(a) The average cost for 2006–2007 was understated due to the over-reporting of 155 service users<br />
by three agencies and data coding errors that occurred between Service 1 and 2, which has<br />
been subsequently corrected in 2007-2008.<br />
Service 2: Individual and Family Support Average Cost Per Service User<br />
The Individual and Family Support Service includes support for people with<br />
disabilities to access positive and constructive day options; maintain health and<br />
develop individual skills and abilities; and family support and respite for carers.<br />
The average cost per service user for 2007–2008 was $6,358 and was 10 per cent<br />
higher than the previous year and equal to the target cost. Individual and Family<br />
Support represented 28 per cent of the <strong>Commission</strong>’s budget and provided support to<br />
79 per cent of service users.<br />
92 <strong>Disability</strong> <strong>Services</strong> <strong>Commission</strong> <strong>Annual</strong> <strong>Report</strong> 2007–2008
![Heerarka Adeegyada Naafada [PDF 102 kB] - Disability Services ...](https://img.yumpu.com/22096139/1/184x260/heerarka-adeegyada-naafada-pdf-102-kb-disability-services-.jpg?quality=85)

![معايير خدمات الإعاقة [PDF 297 kB] - Disability Services Commission](https://img.yumpu.com/22096120/1/184x260/-pdf-297-kb-disability-services-commission.jpg?quality=85)