Disability Services Commission Annual Report
Disability Services Commission Annual Report
Disability Services Commission Annual Report

Create successful ePaper yourself
Turn your PDF publications into a flip-book with our unique Google optimized e-Paper software.
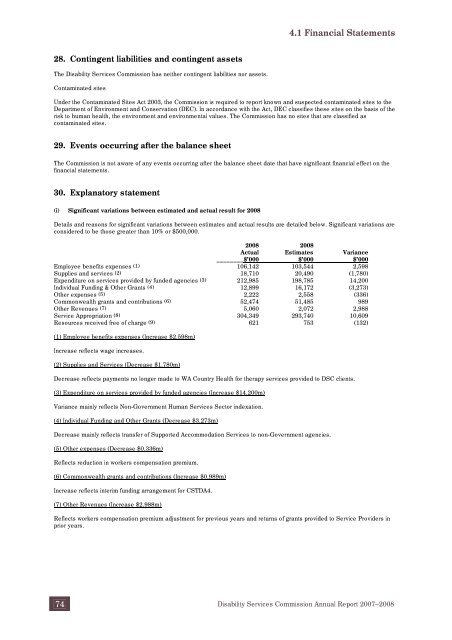
4.1 Financial Statements<br />
28. Contingent liabilities and contingent assets<br />
The <strong>Disability</strong> <strong>Services</strong> <strong>Commission</strong> has neither contingent liabilities nor assets.<br />
Contaminated sites<br />
Under the Contaminated Sites Act 2003, the <strong>Commission</strong> is required to report known and suspected contaminated sites to the<br />
Department of Environment and Conservation (DEC). In accordance with the Act, DEC classifies these sites on the basis of the<br />
risk to human health, the environment and environmental values. The <strong>Commission</strong> has no sites that are classified as<br />
contaminated sites.<br />
29. Events occurring after the balance sheet<br />
The <strong>Commission</strong> is not aware of any events occurring after the balance sheet date that have significant financial effect on the<br />
financial statements.<br />
30. Explanatory statement<br />
(i) Significant variations between estimated and actual result for 2008<br />
Details and reasons for significant variations between estimates and actual results are detailed below. Significant variations are<br />
considered to be those greater than 10% or $500,000.<br />
2008 2008<br />
Actual Estimates Variance<br />
________$’000 $’000 $’000<br />
Employee benefits expenses (1) 106,142 103,544 2,598<br />
Supplies and services (2) 18,710 20,490 (1,780)<br />
Expenditure on services provided by funded agencies (3) 212,985 198,785 14,200<br />
Individual Funding & Other Grants (4) 12,899 16,172 (3,273)<br />
Other expenses (5) 2,222 2,558 (336)<br />
Commonwealth grants and contributions (6) 52,474 51,485 989<br />
Other Revenues (7) 5,060 2,072 2,988<br />
Service Appropriation (8) 304,349 293,740 10,609<br />
Resources received free of charge (9) 621 753 (132)<br />
(1) Employee benefits expenses (Increase $2.598m)<br />
Increase reflects wage increases.<br />
(2) Supplies and <strong>Services</strong> (Decrease $1.780m)<br />
Decrease reflects payments no longer made to WA Country Health for therapy services provided to DSC clients.<br />
(3) Expenditure on services provided by funded agencies (Increase $14.200m)<br />
Variance mainly reflects Non-Government Human <strong>Services</strong> Sector indexation.<br />
(4) Individual Funding and Other Grants (Decrease $3.273m)<br />
Decrease mainly reflects transfer of Supported Accommodation <strong>Services</strong> to non-Government agencies.<br />
(5) Other expenses (Decrease $0.336m)<br />
Reflects reduction in workers compensation premium.<br />
(6) Commonwealth grants and contributions (Increase $0.989m)<br />
Increase reflects interim funding arrangement for CSTDA4.<br />
(7) Other Revenues (Increase $2.988m)<br />
Reflects workers compensation premium adjustment for previous years and returns of grants provided to Service Providers in<br />
prior years.<br />
74 <strong>Disability</strong> <strong>Services</strong> <strong>Commission</strong> <strong>Annual</strong> <strong>Report</strong> 2007–2008
![Heerarka Adeegyada Naafada [PDF 102 kB] - Disability Services ...](https://img.yumpu.com/22096139/1/184x260/heerarka-adeegyada-naafada-pdf-102-kb-disability-services-.jpg?quality=85)
![معايير خدمات الإعاقة [PDF 297 kB] - Disability Services Commission](https://img.yumpu.com/22096120/1/184x260/-pdf-297-kb-disability-services-commission.jpg?quality=85)